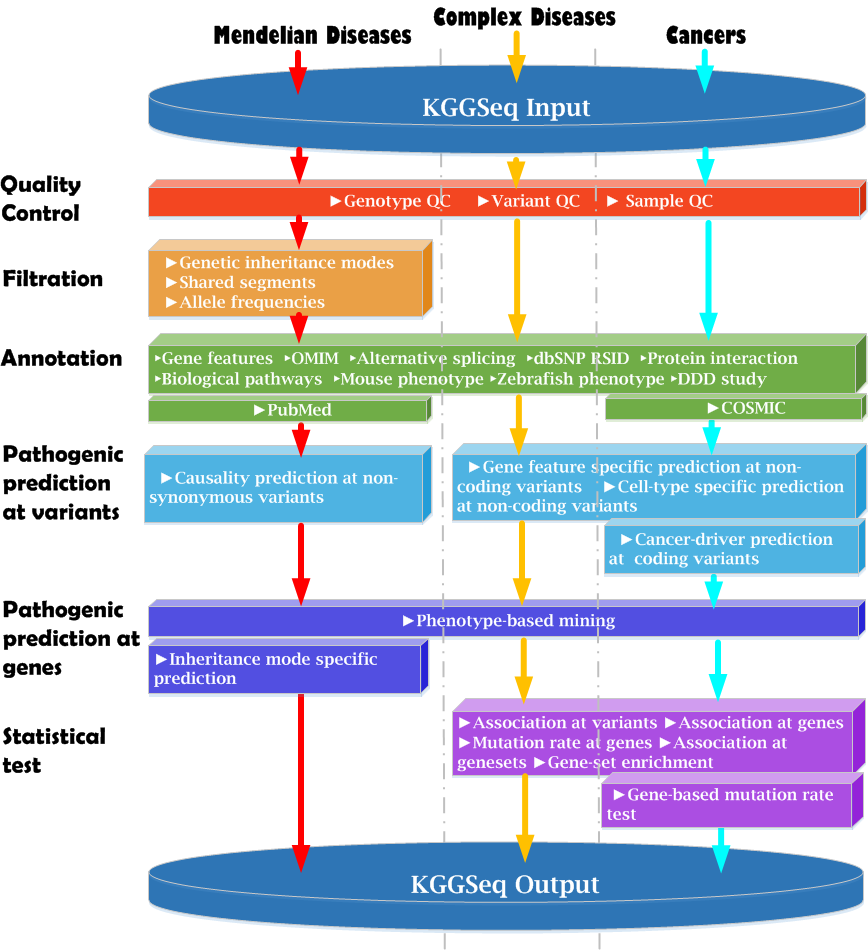
|
Install and run
Short Tutorials
Quick examples
Options |
Note All above quality control functions can be turned off by --no-qc. In addition, KGGSeq can use phenotype information (specified by "--indiv-pheno" or "--ped-file") to filter variants, especially when multiple samples are included in one input file such as trio or case/control study design.
Moreover, It's flexible to match the sample size and missingness of genotypes. Here are the options for different study design. (cases = affected subjects ; controls = unaffected subjects)
After running individual genotype QC, there will be two output files produced: one default KGGSeq output stored in txt (or Excel by specifying "--excel"), in which the basic annotations for each clean variant are provided (see above section); the other one is clean vcf file, in which the variant row which does not meet the conditions specified will be removed completely, hence not considered in following analysis. Note The genomic variant QC is also available for non-vcf type of input, by using type of variants, or genomic position only. Sample QCKGGSeq provides two set of functions to facilitate quality assessment of sequencing data of each subject. Firstly, you can use KGGSeq to convert genotypes from VCF format to PLINK binary genotype format (see Outputs part) so that routine sample QC (pairwise relatedness, mendel error rate and sex check) in genome-wide association study (GWAS) analysis can be performed quickly. The samples with unexpected relationship or error rate are suggested to be removed.
An unexpectedly high pairwise relatedness (denoted by the PI_HAT of plink) suggests cross-individual contamination Note To estimate the relatedness (the PI_HAT), you normally do NOT need the genotypes datasets from 1000 Genome Projects (which will require rather large memory). The merging with ancestry-matched HapMap genotype data is often sufficient for an accurate estimation of relatedness. However, the estimation of PI_HAT without reference genotypes in a small local sample will result in an over-estimated value because of the inaccurate allele frequencies derived from the tiny sample. plink --bfile kggseq --mendel
plink --bfile kggseq --check-sex
Secondly, we provide plotting function (see Plotting part) to visualization the distribution of minor alleles per individual. The outlier from the distribution of total rare variants (MAF < 0.01, or novel in the common database) across all individuals can be easily detected and then ignored in the following analysis.
Note The meanings for -db-filter and --allele-freq in this section are provied in "Allele Frequency Trimming" section.
|
FilteringKGGSeq offers simple but potentially powerful strategies to variants filtering and prioritization, which help users isolate most promising disease causal candiate variants from sequence variants to be considered.Users could prioritize variants based on some or all of the following evidences and/or functions: Genetic inheritance sharing, gene feature, allele frequency, biological function prediction, sequence variant type, and phenotype-relevant filtering. Genetic inheritance sharing
Filter out variants for which their genotypes are not consistent with the assumption of disease inheritance pattern. Functions and applicable models for each code of '--genotype-filter'options are listed below:
Note The inheritance mode based filtration is proposed under strong assumptions for rare Mendelian disease with clear inheritance mode. If the inheritance mode is elusive, such filtration is not suggested as it may lead to the miss of genuine causal mutation(s). This is particularly true when one has no sufficient information to distinguish the compound-heterozygosity diseases from the recessive diseases.
This function is designed for a disorder suspected to be under compound-heterozygous or recessive inheritance mode, in which both copies of a gene on the two homologous chromosomes of a patient are damaged by two different mutations or the same mutation. For recessive mode, it simply checks variants with homozygous genotypes in patients. For the compound-heterozygous mode, it can use two different input data, phased genotypes of a patient or unphased genotypes in a trio. Here the trio refers to the two parents and an offspring. When these alleles causing a disease at one locus, it follows the recessive model; and when they are at two loci, it follows the compound-heterozygosity model. In both cases, a gene is hit twice. This is the reason why it has the name 'double-hit gene'. Besides the file storing prioritized sequence variants, this analysis with --double-hit-gene-trio-filter option will lead to a list of double-hit genes in at least one subject. The counts of double-hit genes of each subject are saved in *.doublehit.gene.trios.flt.count.xls (or *.doublehit.gene.trios.flt.count.txt) and the genotypes of involved sequence variants are saved in *.doublehit.gene.trios.flt.gty.xls (or *.doublehit.gene.trios.flt.gty.txt). The '*doublehit.gene.trios.flt.count*' and the '*doublehit.gene.trios.flt.gty*' files or sheets contain multiple columns:
Gene: Gene symbols
The corresponding files produced by the analysis with --double-hit-gene-phased-filter option are *.doublehit.gene.phased.flt.count.xls (or *.doublehit.gene.phased.flt.count.txt) and *.doublehit.gene.phased.flt.gty.xls (or *.doublehit.gene.phased.flt.gty.txt).
|
|||||||||||||||||||||||||||||||||||||||||||||||||||||||||||||||||||||||||||||||||||||||||||||||||||||||||||||||||||||||||||||||||||||||||||||||||||||||||||||||||||||||||||||||||||||||||||||||||||||||||||||||||||||||||||||||||||||||||||||||||||||||||||||||||||||||||||||||||||||||||||||||||||||||||||||||||||||||||||||||||||||||||||||||||||||||||||||||||||||||||||||||||||||||||||||||||||||||||||||||||||||||||||||||||||||||||||||||||||||||||||||||||||||||||||||||||||||||||||||||||||||||||||||||||||||||||||||||||||||||||||||||||||||||||||||||||||||||||||||||||||||||||||||||||||||||||||||||||||||||||||||||||||||||||||||||||||||||||||||||||||||||||||||||||||||||||||||||||||||||||||||||||||||||||||||||||||||||||||||||||||||||||||||||||||||||||||||||||||||||||||||||||||||||||||||||||||||||||||||||||||||||||||||||||||||||||||||||||||||||||||||||||||||||||||||||||||||||||||||||||||||||||||||||||||||||||||||||||||||||||||||||||||||||||||||||||||||||||||||||||||||||||||||||||||||||||||||||||||||
| Gene database label | Supported reference genome | Description |
| refgene | hg18, hg19 and hg38 | The RefGene database compiled by UCSC from hg18 refGene and hg19 refGene
Note: RefSeq has NO mitochondria gene definition. |
| gencode | hg19 and hg38 | The GENCODE gene sets, gencode.v19.annotation.gtf for hg19 and gencode.v23.annotation.gtf for hg38.See home page and the paper of GENCODE for details.
Note: GENCODE contains similar number of coding genes but more transcripts than RefGene. It HAS the mitochondria gene definition. |
| knowngene | hg18, hg19 and hg38 | The UCSC knonwGene database compiled by UCSC from hg18 knownGene and hg19 knownGene |
| path/to/file | - | KGGSeq also accepts a gene dataset customized by users. The example can be seen here. The following are the column names: bin: The bin ID number name: The name of a transcript chrom: The chromosome name strand: The strand information of the transcript txStart: The start site of a transcript txEnd: The end site of a transcript cdsStart: The start site of coding DNA sequence cdsEnd: The end site of coding DNA sequence exonCount: The number of exons exonStarts: The start sites of all exons exonEnds: The end sites of all exons score: mapping score name2: Gene name cdsStartStat: Un-used cdsEndStat: Un-used exonFrames: Un-used sequences: DNA sequences of exons delSites: Deletion sites on the human reference genome, compared to the latest cDNA insSites: Insertion sites on the human reference genome, compared to the latest cDNA |
With this filter, variants beyond regions sepcified by '--gene-feature-in' will be excluded. It is '--gene-feature-in 0,1,2,3,4,5...,15' by default.
Illustration of number codes for the gene features:| Feature | Code | Explanation |
| Frameshift | 0 | Short insertion or deletion result in a completely different translation from the original. |
| Nonframeshift | 1 | Short insertion or deletion results in loss of amino acids in the translated proteins. |
| Startloss | 2 | Indels or nucleotide substitution result in the loss of start codon(ATG) (mutated into a non-start codon). |
| Stoploss | 3 | Indels or nucleotide substitution result in the loss of stop codons (TAG, TAA, TGA) |
| Stopgain | 4 | Indels or nucleotide substitution result in the new stop codons (TAG, TAA, TGA), which may truncate the protein. |
| Splicing | 5 | variant is within 2-bp of a splicing junction (use --splicing x to change this, the unit of x is base-pair) |
| Missense | 6 | Variants result in a codon coding for a different amino acid (missense) |
| Synonymous | 7 | Nucleotide substitution does not change amino acid. |
| Exonic | 8 | Due to loss of sequences in reference database, this variant can only be mapped into exonic region without more precise annotation. |
| UTR5 | 9 | Within a 5' untranslated region |
| UTR3 | 10 | Within a 3' untranslated region |
| Intronic | 11 | Within an intron |
| Upstream | 12 | Within 1-kb region upstream of transcription start site (use --neargene x to change this, the unit of x is base-pair) |
| Downstream | 13 | Within 1-kb region downtream of transcription end site (use --neargene x to change this, the unit of x is base-pair) |
| ncRNA | 14 | Within a transcript without protein-coding annotation in the gene definition (see Notes below for more explanation) |
| Intergenic | 15 | variant is in intergenic region |
| Monomorphic | 16 | It is not a sequence variation actually, which may be resulted from bugs in reference genome in variant calling. |
| Unknown | 17 | Variants has no annotation. |
MostImportantFeatureGene: The gene corresponds to the variant’s smallest gene feature code.
MostImportantGeneFeature: The variant’s smallest gene feature code.
RefGeneFeatures: All matched gene features in the reference gene database.
GENCODEFeatures: All matched gene features in the GENCODE gene database.
The gene feature annotations are described in accordance with the Human Genome Variation Society (HGVS) recommendations. The followings are some examples:
GBP4:NM_052941:c.1633A.G>C.C:p.M545L:(11Exons):exon10:missense
Means: At nucleotide 1633 and 1635 of gene GBP4's transcript NM_052941, the nucleotides A and G are changed to a C and C respectively, which jointly changes the 545th amino-acid M to be L in this transcript's protein. This transcript has 11 exons in total and this variant is in the 10th exon. The . denotes reference allele.
KLHL17:NM_198317:c.1918A>C:p.T640P:(12Exons):exon12:missense
Means: At nucleotide 1918 of gene KLHL17's transcript NM_198317, an A is changed to a C, which changes the 640th amino-acid T to be P in this transcript's protein. This transcript has 12 exons in total and this variant is in the 12th exon.
SYNGR1:NM_004711:(4Exons):exon4:c.C605ins+CAA:p.P202ins??
Means: At nucleotide 605 of gene SYNGR1's transcript NM_004711, there is a 3bp insertion. This transcript has 4 exons in total and this variant is in the 4th exon. The '+' denotes an insertion. The affected peptide is unknown ('??')
PKD1L2:NM_001076780:c.A705delAA-:p.N236:(18Exons):exon4:frameshift
Means: At nucleotide 705 of gene PKD1L2's transcript NM_001076780, there is a 2bp deletion. This transcript has 18 exons in total and this variant is in the 4th exon. The '-' denotes an deletion. The variant results in a frameshift of protein-coding .
DNAJC8:NM_014280:c.237+2T>G:(9Exons):exon3GTdonor
Means:This is a T to G substitution of the 2nd nucleotide of the 2 nd intron (from its 5' part) positioned between coding DNA nucleotides 237 and 238, which will affect the GT splicing donor.
HNRNPCL2:NM_001136561:c.-169C>G:(2Exons):5UTR
Means: This is a C to G substitution of nucleotide, 169 nucleotides upstream of the ATG translation initiation codon (coding DNA -169).
PRAMEF4:NM_001009611:c.*62C>T:(4Exons):3UTR
Means: This is a C to T substitution of nucleotide coding DNA 62, located in the 3' UTR.
C1orf159:NM_017891:c.311-23T>C:(10Exons):intronic6
Means: This is a T to C substitution of the 23 nucleotide of the 6 th intron (from its 3' part) positioned between coding DNA nucleotides 310 and 311.
HNRNPCL1:NM_001013631:c.*138G>A:(2Exons):downstream
Means: This is a C to A substitution of nucleotide located 138 nucleotides downstream of the gene, i.e. the polyA-addition site.
TNFRSF18:NM_148901:c.-61C>T:(4Exons):upstream
Means: This is a C to T substitution of nucleotide, 61 nucleotides upstream of the ATG translation initiation codon (coding DNA -61).
Table: Compare non-synonymous gene feature annotation of three popular tools and two gene models for variants discovered in 1000 Genomes Project AFR panel
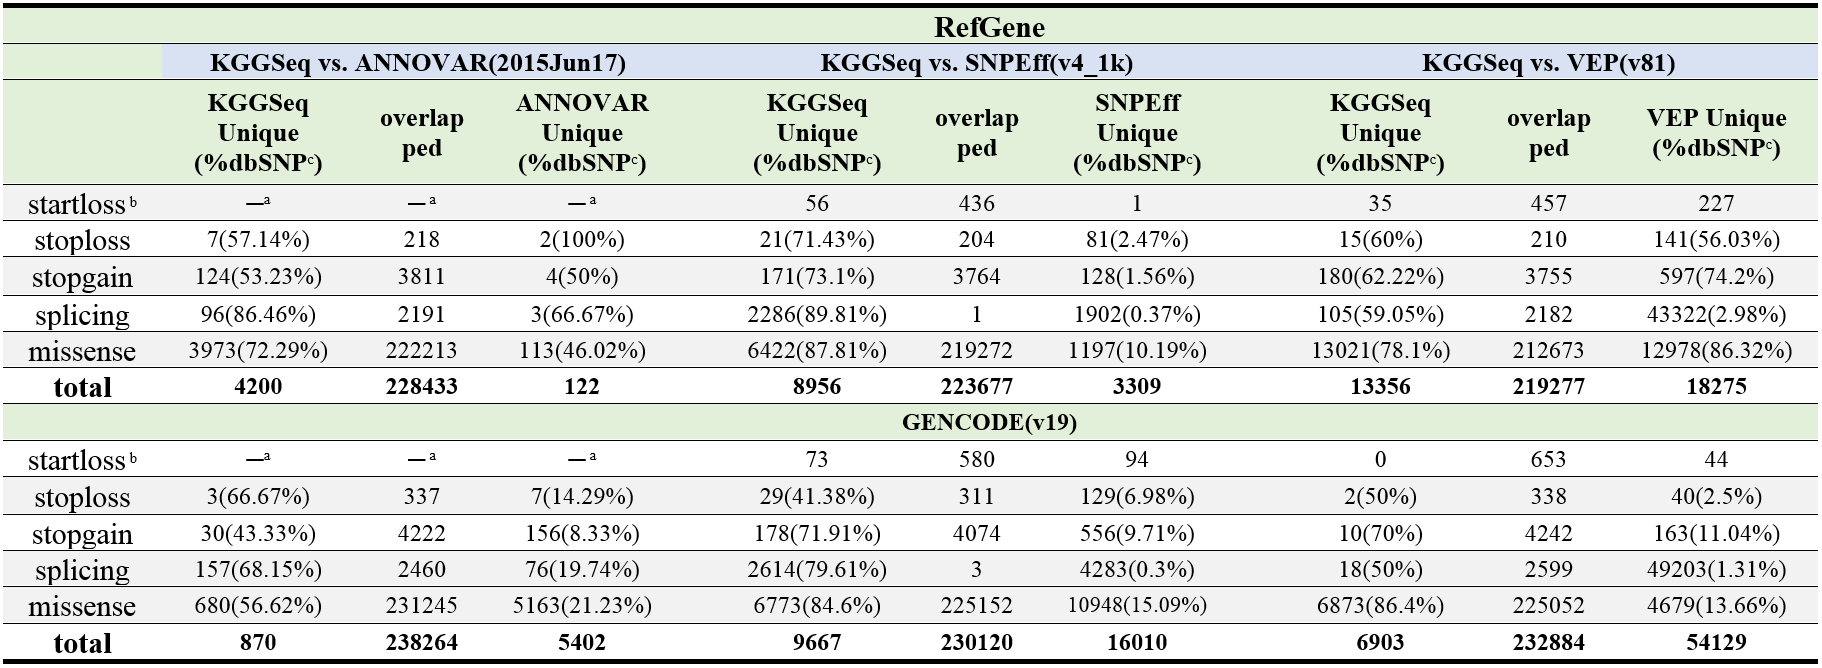
Note: The RefGene model was provided by UCSC on Oct 10, 2015 for KGGSeq; and for ANNOVAR and the latest RefGene model (by Oct 10, 2015) from their websites was used. a: Because ANNOVAR has no startloss category but annotates startloss as missense, no comparison was made for this category. b: Because dbSNP has no startloss category, no consistency was calculated for this category. c: rate of consistency with annotations in the dbSNP. The default parameters settings of each tool were used for the annotation.
Allele frequency trimming by 4 ways
![]() 1. Allele frequency trimming according to database: --db-filter
1. Allele frequency trimming according to database: --db-filter
java -jar ./kggseq.jar --buildver hg19 --vcf-file path/to/file1 --ped-file path/to/file2 --db-filter 1kg201204,dbsnp141,ESP6500AA,ESP6500EA --rare-allele-freq 0.005 --db-filter-hard dbsnp138nf
This mode enables variants filtering according to allele frequencies recorded in public data sources. The '--db-filter' is use to set databases for filtration. In the above case, variants with alternative allele frequency EQUAL to or over 0.005 will be excluded. No spaces are allowed between and within database names.
Moreover, '--db-filter-hard' is use to filter ALL existing variants in a database. But it should be always careful to use this hard filtering.
Note1. To keep variants in a frequency range,[a,b], please use '--allele-freq a,b' option. The boundaries a and b are included.
Note2. The options, '--allele-freq' and '--rare-allele-freq', are mutually exclusive and the latter has higher priority.
Note3. By default, '--rare-allele-freq 0.01', will be used if allele frequency cutoff is set.
Note4. Difference between '--rare-allele-freq' and '--allele-freq': The '--rare-allele-freq 0,0.01' does not consider the variants with missing frequency in public databases, but '--rare-allele-freq 0.01' does. So '--rare-allele-freq 0.01' returns much more variants than '--rare-allele-freq 0,0.01'.
List of public databases for allele frequency trimming
| DB Label | Explanation |
| 1kgeur201305 | 495 subjects in the EUR panel of 1000 Genomes Project release in 2013 May (around 24.0 million sequence variants) |
| 1kgeas201305 | 496 subjects in the EAS panel of 1000 Genomes Project release in 2013 May (around 23.5 million sequence variants) |
| 1kgafr201305 | 645 subjects in the AFR panel of 1000 Genomes Project release in 2013 May (around 41.7 million sequence variants) |
| 1kgsas201305 | 485 subjects in the SAS panel of 1000 Genomes Project release in 2013 May (around 26.7 million sequence variants) |
| 1kgamr201305 | 346 subjects in the AMR panel of 1000 Genomes Project release in 2013 May (around 28.2 million sequence variants) |
| 1kg201305 | All sample of 1000 Genomes Project release 2013 May (over 81 million sequence variants from 2504 subjects) |
| 1kg201204 | All sample of 1000 Genomes Project release 2012 April |
| 1kgafr201204 | African descendent samples of 1000 Genomes Project release in 2012 April |
| 1kgeur201204 | European descendent samples of 1000 Genomes Project release in 2012 April |
| 1kgamr201204 | American descendent samples of 1000 Genomes Project release in 2012 April |
| 1kgasn201204 | Asian descendent samples of 1000 Genomes Project release in 2012 April |
| dbsnp135 | dbSNP version 135, compiled from UCSC. |
| dbsnp137 | dbSNP version 137, compiled from UCSC. |
| dbsnp138 | dbSNP version 138, compiled from UCSC. |
| dbsnp138nf | dbSNP version 138 without the flagged SNPs by UCSC (so nonflagged: nf). In UCSC the flagged SNPs include SNPs clinically associated by dbSNP, mapped to a single location in the reference genome assembly, and not known to have a minor allele frequency of at least 1%. |
| dbsnp141 | dbSNP version 141, compiled from NCBI dbSNP V141. Note Indels are ignored. |
| ESP5400 | a public variants dataset from NHLBI GO Exome Sequencing Project (ESP) |
| ESP6500AA | a public variants dataset of African American from NHLBI GO Exome Sequencing Project (ESP) |
| ESP6500EA | a public variants dataset of European American from NHLBI GO Exome Sequencing Project (ESP) |
| exac | Exome Aggregation Consortium (ExAC r0.3.1): Variants from 60,706 unrelated individuals sequenced. The samples are partitioned in to 7 ancestrally different panels, East Asian(eas, n=4327), South Asian (sas, n=8256), African/African American(afr, n= 5203), American(amr, n=5789 ), Finnish(fin, n=3307), Non-Finnish European(nfe, n=33370), Other (oth, n=454). By default (--db-filter exac), KGGSeq will use frequencies of all of the 7 panels for annotation and filtering. You can also specify the panels of your interests by the abbreviations. For example, you can specify the frequencies by of East Asian and Non-Finnish European by --db-filter exac.eas.nfe. |
| ehr | DiscovEHR: More than 4 million Variants from more than 50,000 MyCode® participants. The DiscovEHR Collaboration between the Regeneron Genetics Center and Geisinger Health System brings together high throughput DNA sequencing with longitudinal electronic health records for discovery of genetic variation important for human disease and therapeutic response. |
| gadexome | Genome Aggregation Database: More than 15 million Variants from more than 123,136 participants sequenced in exomes. The samples are partitioned in to 8 ancestrally different panels, East Asian(eas, n=8,624), South Asian (sas, n=15,391), African/African American(afr, n=7,652), Latino (amr, n=16,791), Finnish(fin, n=11,150), Non-Finnish European(nfe, n=55,860),Ashkenazi Jewish (asj, n=4,925), Other (oth, n=2,743). By default (--db-filter gadexome), KGGSeq will use frequencies of all of the 8 panels for annotation and filtering. You can also specify the panels of your interests by the abbreviations. For example, you can specify the frequencies by of East Asian and Non-Finnish European by --db-filter gadexome.eas.nfe. |
| gadgenome | Genome Aggregation Database: More than 229 million Variants from more than 15,496 participants sequenced in whole genomes. The samples are partitioned in to 7 ancestrally different panels, East Asian(eas, n=881), African/African American(afr, n=4,368), Latino (amr, n=419), Finnish(fin, n=1,747), Non-Finnish European(nfe, n=7,509),Ashkenazi Jewish (asj, n=151), Other (oth, n=491). By default (--db-filter gadgenome), KGGSeq will use frequencies of all of the 7 panels for annotation and filtering. You can also specify the panels of your interests by the abbreviations. For example, you can specify the frequencies by of East Asian and Non-Finnish European by --db-filter gadgenome.eas.nfe. |
MaxDBAltAF: The maximum alternative allele frequency across datasets specified.
altFreq@hgXX_XXXXX: The alternative allele frequency at a dataset hgXX_XXXXX.
NoteVariants without allele frequencies in reference databases are marked by '.' in the results. Moreover, Variants not EXISTING in reference database are marked by 'N'.
java -jar ./kggseq.jar --buildver hg19 --vcf-file path/to/file1 --ped-file path/to/file2 --local-filter path/to/file3 --rare-allele-freq 0.005 --local-filter-hard path/to/file4
The '--local-filter' option sets local datasets for filterating. KGGSeq accepts local dataset files in the following format: each file has 5 columns [Chromosome, Physical Position, Reference Allele, Alternative Allele(s), and Frequency of alternative allele(s)], separated by tab character. KGGSeq provides a function to convert data in VCF format to that in the local dataset format:
java -jar ./kggseq.jar --make-filter --vcf-file path/to/file --out test.var
An example file is like:
Chrom Position Reference Alternative Freq
1 469 C G 0.150
1 492 C T 0.175
1 519 G C 0.067
1 874290 - 0ACAGAG 0.809
1 875913 CAG 3 0.8431
Note The title line is needed and Freq is optional.
![]() 3. An in-house VCF file can be used for allele frequency trimming: --local-filter-vcf
3. An in-house VCF file can be used for allele frequency trimming: --local-filter-vcf
java -jar ./kggseq.jar --buildver hg19 --vcf-file path/to/file1 --ped-file path/to/file2 --local-filter-vcf path/to/file3 --rare-allele-freq 0.005 --local-filter-vcf-hard path/to/file4
If the data were stored in different files chromosome by chromosome, you can use ' _CHROM_' to denote the chromosome names [1...Y] or directly specify [1,2,X] in the file name so that KGGSeq can read data in multiple files in a run.
Similarly, '--local-filter-vcf-hard' is use to filter ALL existing variants in a database.![]() 4. An in-house VCF file without genotypes can also be used for allele frequency trimming: --local-filter-no-gty-vcf
4. An in-house VCF file without genotypes can also be used for allele frequency trimming: --local-filter-no-gty-vcf
java -jar ./kggseq.jar --buildver hg19 --vcf-file path/to/file1 --ped-file path/to/file2 --local-filter-no-gty-vcf path/to/file3 --rare-allele-freq 0.005 --local-filter-no-gty-vcf-hard path/to/file4
![]() 5. Filter variants by minor allele frequency in the input sample: --filter-sample-maf-le or --filter-sample-maf-oe
5. Filter variants by minor allele frequency in the input sample: --filter-sample-maf-le or --filter-sample-maf-oe
java -jar ./kggseq.jar --buildver hg19 --vcf-file path/to/file1 --ped-file path/to/file2 --filter-sample-maf-le 0.01
--filter-sample-maf-oe: Filter out variants with minor allele frequency over OR equal to a cutoff (x) in the input samples.
![]() 6. Filter variants by minor allele frequency in the input sample: --filter-case-maf-le or --filter-case-maf-oe
6. Filter variants by minor allele frequency in the input sample: --filter-case-maf-le or --filter-case-maf-oe
java -jar ./kggseq.jar --buildver hg19 --vcf-file path/to/file1 --ped-file path/to/file2 --filter-case-maf-le 0.01
--filter-case-maf-oe: Filter out variants with minor allele frequency over OR equal to a cutoff (x) in the input cases.
![]() 7. Filter variants by minor allele frequency in the input controls --filter-control-maf-le or --filter-control-maf-oe
7. Filter variants by minor allele frequency in the input controls --filter-control-maf-le or --filter-control-maf-oe
java -jar ./kggseq.jar --buildver hg19 --vcf-file path/to/file1 --ped-file path/to/file2 --filter-control-maf-le 0.01
--filter-control-maf-oe: Filter out variants with minor allele frequency over OR equal to a cutoff (x) in the input controls.
Variant type, region and gene filtering
![]() Ignore copy number variation variants (CNV): --ignore-cnv
Ignore copy number variation variants (CNV): --ignore-cnv
java -jar ./kggseq.jar --buildver hg19 --vcf-file path/to/file1 --ped-file path/to/file2 --ignore-cnv
![]() Ignore insertion and deletion sequence variants (indels): --ignore-indel
Ignore insertion and deletion sequence variants (indels): --ignore-indel
java -jar ./kggseq.jar --buildver hg19 --vcf-file path/to/file1 --ped-file path/to/file2 --ignore-indel
![]() Accordingly, users can also ask KGGSeq to ingore Single nucleotide variants (SNVs) : --ignore-snv
Accordingly, users can also ask KGGSeq to ingore Single nucleotide variants (SNVs) : --ignore-snv
java -jar ./kggseq.jar --buildver hg19 --vcf-file path/to/file1 --ped-file path/to/file2 --ignore-snv
By default, KGGSeq will process all the three types of variants.
![]() Ingore single nucleotide variants (SNVs) with alleles of C/T or T/C: --ignore-ct-var
Ingore single nucleotide variants (SNVs) with alleles of C/T or T/C: --ignore-ct-var
java -jar ./kggseq.jar --buildver hg19 --vcf-file path/to/file1 --ped-file path/to/file2 --ignore-ct-var
![]() Ingore single nucleotide variants (SNVs) without alleles of C/T and T/C: --only-ct-var
Ingore single nucleotide variants (SNVs) without alleles of C/T and T/C: --only-ct-var
java -jar ./kggseq.jar --buildver hg19 --vcf-file path/to/file1 --ped-file path/to/file2 --ignore-ct-var
By default, KGGSeq will process all variants regardless of C/T allele. The option could be used with WITER or RUNNER for gene-based mutation burden tests .
![]() Ignore some genomic regions: --regions-out
Ignore some genomic regions: --regions-out
java -jar ./kggseq.jar --buildver hg19 --vcf-file path/to/file1 --ped-file path/to/file2 --regions-out chrX,chrY:1-10000
![]() Alternatively, one can also exclusively process sequence variants at some genome regions:
Alternatively, one can also exclusively process sequence variants at some genome regions:
java -jar ./kggseq.jar --buildver hg19 --vcf-file path/to/file1 --ped-file path/to/file2 --regions-in chr2,chr4:21212-233454
![]() Ignore variants within some genes: --genes-out
Ignore variants within some genes: --genes-out
java -jar ./kggseq.jar --buildver hg19 --vcf-file path/to/file1 --ped-file path/to/file2 --genes-out TCF4,CNNM2,ANK3
![]() Alternatively, one can KEEP variants only within some genes:
Alternatively, one can KEEP variants only within some genes:
java -jar ./kggseq.jar --buildver hg19 --vcf-file path/to/file1 --ped-file path/to/file2 --genes-in TCF4,CNNM2,ANK3
![]() Filter out genes with too many variants: --ignore-gene-over-var
Filter out genes with too many variants: --ignore-gene-over-var
java -jar ./kggseq.jar --buildver hg19 --vcf-file path/to/file1 --ped-file path/to/file2 [options to filter out common and neutral variants] --ignore-gene-over-var 5
After a number of hard-filtering by allele frequencies and pathogenic prediction, you may see some genes harboring candidate variants in one or more persons. Empirically, these genes are usually not interesting and their mutations are often produced by some unknown factors such pseudogene or platform bias. This option allows users to remove all mutations of this person at this problematic gene. As a rule of thumb, it is safe to set a cutoff 5 or more.
![]() Filter out genes with too few variants: --ignore-gene-fewer-var
Filter out genes with too few variants: --ignore-gene-fewer-var
java -jar ./kggseq.jar --buildver hg19 --vcf-file path/to/file1 --ped-file path/to/file2 [options to filter out common and neutral variants] --ignore-gene-fewer-var 1
After a number of hard-filtering by allele frequencies and pathogenic prediction, you may see some genes harboring two few variants. Empirically, in genes-based association tests for rare variants, it may be better to exclude genes with only 1 variant.
Super duplicate region filtering
![]() Filter out variants in super duplicate regions: --superdup-filter
Filter out variants in super duplicate regions: --superdup-filter
java -jar ./kggseq.jar --buildver hg19 --vcf-file path/to/file1 --ped-file path/to/file2 --superdup-filter
KGGSeq can eliminate sequence variants within putative super-duplicate genomic regions defined in a dataset (genomicSuperDups) from UCSC datasets , which have higher genotyping error rate. (See more ).
Note Another option --superdup-annot allows you to just mark (but not to remove) the variants in the super duplicate regions. A column named SuperDupKValue (K-value calculated with Jukes-Cantor model) will be added in the resulting dataset
Case-control Phenotype
java -jar ./kggseq.jar --buildver hg19 --vcf-file path/to/file1 --ped-file path/to/file2 --filter-model case-unique
Case unique: extract variants with alternative alleles only present among affected individuals.Control unique: extract variants with alternative alleles only present among unaffected individuals.
Note The --filter-model only works for inputs specified by --vcf-file .
Note This function can work with options to flexibly set the sample size and missingness of genotypes, detalied in the Variant QC part.
Expression at specified tissues
java -jar ./kggseq.jar --buildver hg19 --vcf-file path/to/file1 --ped-file path/to/file2 --var-expression-tissues TissueLabel1,TissueLabel2,TissueLabel3 --min-var-expression 0.1
--var-expression-tissues: specify the tissue of cell types where the coding variants are expressed. The expression information is retrieved from a Nature paper, which were generated based on the GTEx dataset. The following are tissue or cell-type names.| Number | TissueLabel | Explanation |
| 1 | Cells_Transformedfibroblasts | Cells of transformed fibroblasts. |
| 2 | Prostate | Prostate |
| 3 | Spleen | Spleen |
| 4 | Brain_FrontalCortex_BA9_ | Brain_FrontalCortex_BA9_ |
| 5 | SmallIntestine_TerminalIleum | SmallIntestine_TerminalIleum |
| 6 | MinorSalivaryGland | MinorSalivaryGland |
| 7 | Artery_Coronary | Artery_Coronary |
| 8 | Skin_SunExposed_Lowerleg_ | Skin_SunExposed_Lowerleg_ |
| 9 | Cells_EBV_transformedlymphocytes | Cells_EBV_transformedlymphocytes |
| 10 | Brain_Hippocampus | Brain_Hippocampus |
| 11 | Esophagus_Muscularis | Esophagus_Muscularis |
| 12 | Brain_Nucleusaccumbens_basalganglia_ | Brain_Nucleusaccumbens_basalganglia_ |
| 13 | Artery_Tibial | Artery_Tibial |
| 14 | Brain_Hypothalamus | Brain_Hypothalamus |
| 15 | Adipose_Visceral_Omentum_ | Adipose_Visceral_Omentum_ |
| 16 | Cervix_Ectocervix | Cervix_Ectocervix |
| 17 | Brain_Spinalcord_cervicalc_1_ | Brain_Spinalcord_cervicalc_1_ |
| 18 | Brain_CerebellarHemisphere | Brain_CerebellarHemisphere |
| 19 | Nerve_Tibial | Nerve_Tibial |
| 20 | Breast_MammaryTissue | Breast_MammaryTissue |
| 21 | Liver | Liver |
| 22 | Skin_NotSunExposed_Suprapubic_ | Skin_NotSunExposed_Suprapubic_ |
| 23 | AdrenalGland | AdrenalGland |
| 24 | Vagina | Vagina |
| 25 | Pancreas | Pancreas |
| 26 | Lung | Lung |
| 27 | FallopianTube | FallopianTube |
| 28 | Pituitary | Pituitary |
| 29 | Muscle_Skeletal | Muscle_Skeletal |
| 30 | Colon_Transverse | Colon_Transverse |
| 31 | Artery_Aorta | Artery_Aorta |
| 32 | Heart_AtrialAppendage | Heart_AtrialAppendage |
| 33 | Adipose_Subcutaneous | Adipose_Subcutaneous |
| 34 | Esophagus_Mucosa | Esophagus_Mucosa |
| 35 | Heart_LeftVentricle | Heart_LeftVentricle |
| 36 | Brain_Cerebellum | Brain_Cerebellum |
| 37 | Brain_Cortex | Brain_Cortex |
| 38 | Thyroid | Thyroid |
| 39 | Brain_Substantianigra | Brain_Substantianigra |
| 40 | Kidney_Cortex | Kidney_Cortex |
| 41 | Uterus | Uterus |
| 42 | Stomach | Stomach |
| 43 | WholeBlood | WholeBlood |
| 44 | Bladder | Bladder |
| 45 | Brain_Anteriorcingulatecortex_BA24_ | Brain_Anteriorcingulatecortex_BA24_ |
| 46 | Brain_Putamen_basalganglia_ | Brain_Putamen_basalganglia_ |
| 47 | Brain_Caudate_basalganglia_ | Brain_Caudate_basalganglia_ |
| 48 | Colon_Sigmoid | Colon_Sigmoid |
| 49 | Cervix_Endocervix | Cervix_Endocervix |
| 50 | Ovary | Ovary |
| 51 | Esophagus_GastroesophagealJunction | Esophagus_GastroesophagealJunction |
| 52 | Testis | Testis |
| 53 | Brain_Amygdala | Brain_Amygdala |
| 54 | mean_proportion | Averaged proportion in all tissues/cell-types |
--min-var-expression: filter out variants with the standardized expression ≤ the specified value, (ranged from 0 to 1).
Annotation
dbSNP RSID
Assign dbSNP RSID to variants:--rsid
java -jar kggseq.jar --vcf-file path/to/file1 --ped-file path/to/file2 --rsid
KGGSeq can update the variants' dbSNP rsID (if available) according to their genomic coordinates. The resource data used are from
SNPChrPosOnRef (hg19/hg38) [help].
Alternative splicing
Potential of altering splicing--scsnv-annotjava -jar kggseq.jar --vcf-file path/to/file1 --ped-file path/to/file2 --scsnv-annot
Annotate a SNV with predicted potential of altering splicing from dbscSNV , which include all possible human SNVs within splicing consensus regions (-3 to +8 at the 5' splice site and -12 to +2 at the 3' splice site).
The command will append a field to the output file.
ada_score@dbScSNV: The prediction score by ADA approach which combines multiple existing tools. See more in Jian et al (2014)
Structure variation
Map a variant against known structure variation --dgv-cnv-annotjava -jar kggseq.jar --vcf-file path/to/file1 --ped-file path/to/file2 --dgv-cnv-annot
Annotate a variant whether it is within a known insertion or deletion registered in the Database of Genomic Variants , which will help exclude candidates which are not interesting.
The command will append a field to the output file.
DGVIDs: the ID in the Database of Genomic Variants.
CNVSampleSize: the size of sample, used to derive the structure.
LossCNV: Number of subjects having loss of copy number variation.
GainCNV: Number of subjects having excessive copy number variation.
Shared protein-protein interactions (PPIs)
Examine whether variants share the same PPIs with some genes of interest: --candi-list gene1,gene2,...,geneN --ppi-annot ppiDatabase
java -jar kggseq.jar --vcf-file path/to/file1 --ped-file path/to/file2 --candi-list gene1,gene2,...,geneN --ppi-annot string --ppi-depth 1
Note Currently, the only supported PPI database is STRING (i.e., string).
Note Instead of specifying the gene list using the --candi-list option, users can specify a file containing the list using the --candi-file option.
In the file containing candidate genes, each row can only have one gene. The format is like the following:
GeneSymbol1
GeneSymbol2
GeneSymbol3
GeneSymbol4
Note The maximum distance of a PPI between a specifified candidate genes and a gene containing the potential causal variants can be adjusted using the --ppi-depth option. The defaul is --ppi-depth 1.
IsWithinCandidateGene: Whether the variant is within a candidate gene
PPI: PPI shared by at least one gene of interest and the gene
containing the variant
Shared genesets
Examine whether variants share the same genesets with some genes of interest: --candi-list gene1,gene2,...,geneN --geneset-annot GenesetDatabase
java -jar kggseq.jar --vcf-file path/to/file1 --ped-file path/to/file2 --candi-list gene1,gene2,...,geneN --geneset-annot GeneSetDatabase
Currently, users can choose between 5 geneset databases from GSEA. The following are brief descriptions of the 5 datasets COPIED from the page of GSEA.
| GeneSetDatabase | Description | Version |
|---|---|---|
| cano | Gene sets from the geneset databases. Usually, these gene sets are canonical representations of a biological process compiled by domain experts. (1452 gene sets) | MSigDB 3.1 |
| cura | Curated gene sets: Gene sets collected from various sources such as online geneset databases, publications in PubMed, and knowledge of domain experts. The gene set page for each gene set lists its source. (4850 gene sets) | MSigDB 3.1 |
| onco | Oncogenic signatures: Gene sets represent signatures of cellular genesets which are often dis-regulated in cancer. The majority of signatures were generated directly from microarray data from NCBI GEO or from internal unpublished profiling experiments which involved perturbation of known cancer genes. In addition, a small number of oncogenic signatures were curated from scientific publications. (189 gene sets) | MSigDB 3.1 |
| cmop | Computational gene sets: Computational gene sets defined by mining large collections of cancer-oriented microarray data. (858 gene sets) | MSigDB 3.1 |
| onto | GO gene sets Gene sets are named by GO term and contain genes annotated by that term. GSEA users: Gene set enrichment analysis identifies gene sets consisting of co-regulated genes; GO gene sets are based on ontologies and do not necessarily comprise co-regulated genes. (1454 gene sets) | MSigDB 3.1 |
Note The --candi-list and --candi-file options can be shared with --ppi-annot.
The option will append the following fields to the output file:
IsWithinCandidateGene: Whether the variant is within a candidate gene
SharedGeneSet: GeneSet shared by at least one gene of interest and the gene
containing the variant
Mouse Phenotype
Annotate the genes with known mouse phenotypes as reference: --mouse-pheno.
java -jar kggseq.jar --vcf-file path/to/file1 --ped-file path/to/file2 --mouse-pheno
The genes harboring interested mutations will be annotated by known mouse phenotypes of ortholog genes in the file of Mouse/Human Orthology with Phenotype Annotations from Mouse Genome Informatics(MGI) and in the file of phenotype-genotype from International Mouse Phenotyping Consortium (IMPC) An column will be appended in the main output file:
MousePhenotype (MGI):mouse phenotypes of ortholog genes. Multiple phenotypes are separated by '||'.
MousePhenotype (IMPC):mouse phenotypes of ortholog genes. Multiple phenotypes are separated by '||'.
Zebrafish Phenotype
Annotate the genes with known zebrafish phenotypes as reference: --zebrafish-pheno.
java -jar kggseq.jar --vcf-file path/to/file1 --ped-file path/to/file2 --zebrafish-pheno
The genes harboring interested mutations will be annotated by known zebrafish phenotypes of ortholog genes in the file of Phenotypic Zebrafish genes with Human Orthology from The Zebrafish Model Organism Database. An column will be appended in the main output file:
ZebrafishPhenotype :Affected structure or process subterm after the knock-out of the human ortholog genes in Zebrafish.
DDD Study
Annotate by disease names in Deciphering Developmental Disorders (DDD) study: --ddd-annot.
java -jar kggseq.jar --vcf-file path/to/file1 --ped-file path/to/file2 --ddd-annot
The genes harboring interested mutations will be annotated by the documented disease names in Gene-based genotype to phenotype of Deciphering Developmental Disorders (DDD) study . An column will be appended in the main output file:
DDDPhenotype : confirmation status;disease;pubmed_ids
PubMed literature
Assign PubMed ID to a gene:--phenotype-term searchTerm and --pubmed-mining
java -jar kggseq.jar --vcf-file path/to/file1 --ped-file path/to/file2 --phenotype-term search+Term1,search+Term2 --pubmed-mining
KGGSeq can mine the titles and abstracts of published papers in PubMed via the NCBI E-utilities to find a co-mention with the searched term(s) of interest (i.e., disease) and the genes/cytogeneic regions in which the
variants are located. The option --pubmed-mining will append the following two fields to the output file.
PubMedIDIdeogram : PubMed ID of articles in which the term and the cytogeneic
position of the variant are co-mentioned
PubMedIDGene : PubMed ID of articles in which the term and the gene
containing the variant are co-mentioned
IMPORTANT Please use + instead of blank characters within a search term.
OMIM
Assign OMIM term to a gene --omim-annotjava -jar kggseq.jar --vcf-file path/to/file1 --ped-file path/to/file2 --omim-annot
KGGSeq can extract all available disorder names linked to a gene in which the
variants are located from the OMIM dataset morbidmap. The command will append two extra fields to the output file:
DiseaseName(s)MIMid : Disorder, <disorder MIM no.> (<phene mapping key>)
Phenotype mapping method <phene mapping key>:
1 - the disorder is placed on the map based on its association with
a gene, but the underlying defect is not known.
2 - the disorder has been placed on the map by linkage; no mutation has
been found.
3 - the molecular basis for the disorder is known; a mutation has been
found in the gene.
4 - a contiguous gene deletion or duplication syndrome, multiple genes
are deleted or duplicated causing the phenotype.
GeneMIMid : Gene/locus MIM no.
COSMIC cancer information
Assign COSMIC cancer annotation to a gene: --cosmic-annotjava -jar kggseq.jar --vcf-file path/to/file1 --ped-file path/to/file2 --indiv-pair NONTUMOR.1:TUMOR.1,NONTUMOR.2:TUMOR.2 --genotype-filter 8 --cosmic-annot
KGGSeq can retrieve the confirmed somatic mutation information registered for variants and genes in the COSMIC database.
The command will append a field to the output file. e.g.,
COSMICCancerInfo : known cancer and occurrence time of the somatic mutation in COSMIC dataset. e.g., {serous_carcinoma=3, astrocytoma_Grade_IV=1}
This somatic mutation occurred 3 times in samples of 'serous_carcinoma' and once in samples of 'astrocytoma_Grade_IV'.
Prediction at variant
KGGSeq provides a series of methods to combine existing functional scores of DNA variants from multiple algorithms (i.e., SIFT, PolyPhen2, GWAVA and CADD) for a more accurate pathogenic prediction at coding and non-coding variants.Predicting Mendelian disease-causing variants
Predict Mendelian disease-causing variants: --db-score dbnsfp --mendel-causing-predict
java -jar kggseq.jar --vcf-file path/to/file1 --ped-file path/to/file2 --db-score dbnsfp --mendel-causing-predict best --filter-nondisease-variant
Use functional or deleterious scores (listed below) collected in dbNSFP v3.0+ database to RE-predict whether a nonsynonymous single nucleotide variant (SNV) will potentially be Mendelian disease causal or not by Logistic regression model (See methods in our paper, Li et al. PLoS Genet. 2013 Jan;9(1):e1003143). By default, KGGSeq try the top 10 subsets of the scores (according to their area under the curves (AUC) of receiver operating characteristic (ROC)) for a combinatorial prediction until a positive prediction occurs. This is a way to relief influence of missing values. Users can try more subsets by a number on the option, say --mendel-causing-predict best30. However, a larger number will increase the false positive rate. In conjunction with the prediction model, the --filter-nondisease-variant tag will be used to filter out the nondisease-causative variants predicted by Logistic regression model (See methods in Li et al. PLoS Genet. 2013 Jan;9(1):e1003143). .Note that this trying will increase the false positive rate although it decreases the false negative rate. So you may need more information to justify the involved gene(s).
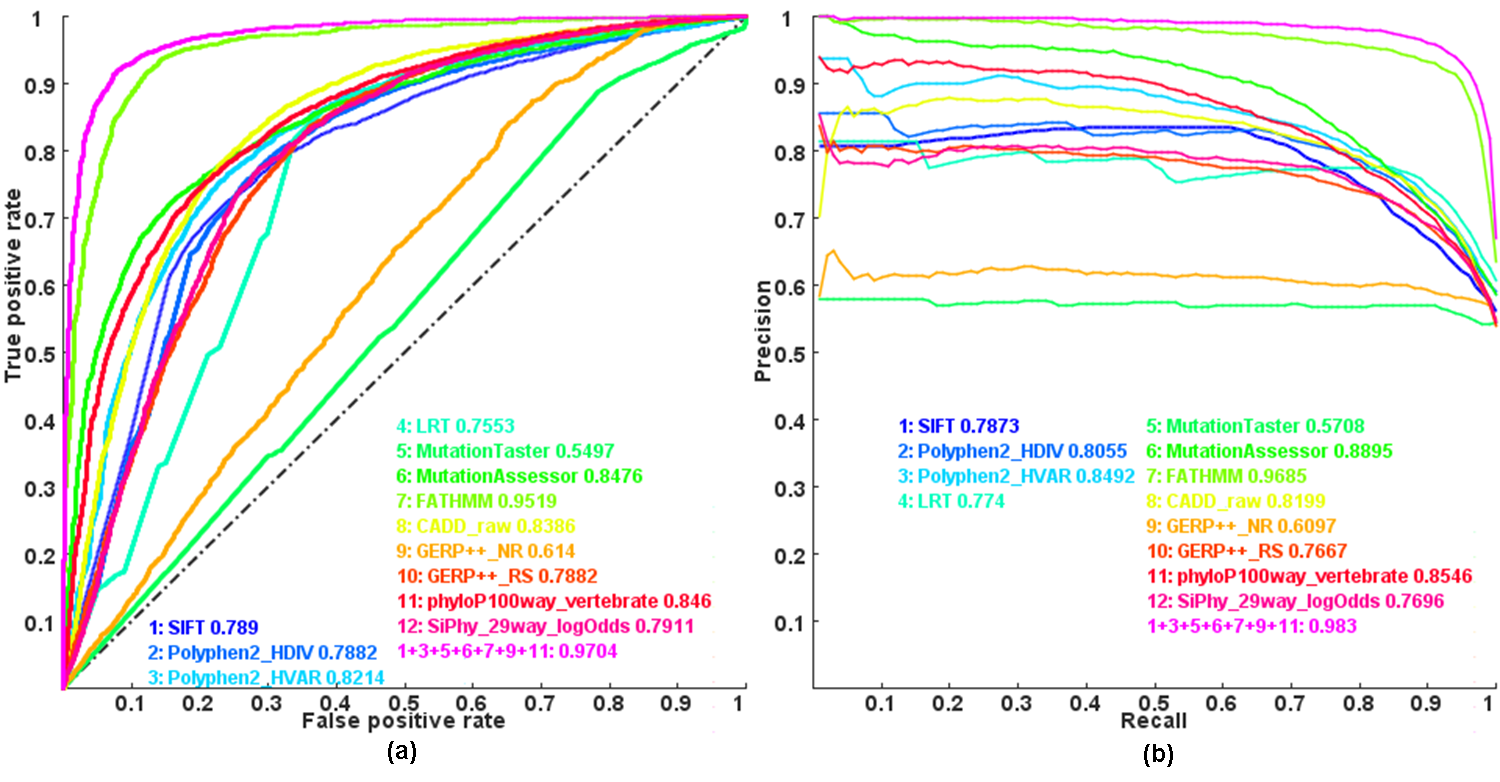
Figure: Receiver operating characteristic (ROC) and Precision recall(PR) curves and area under the curves (AUC) of individual scores and combined score by Logistic regression model
Note: this is an updated plot of Figure 1 in our paper . Here we combined more individual functional impact scores, which is the only difference.
Although the logistic regression model was proposed more than 6 years ago,it has comparable performance with two recent methods, REVEL (Am J Hum Genet. 2016) and M-CAP (Nat Genet. 2016) .
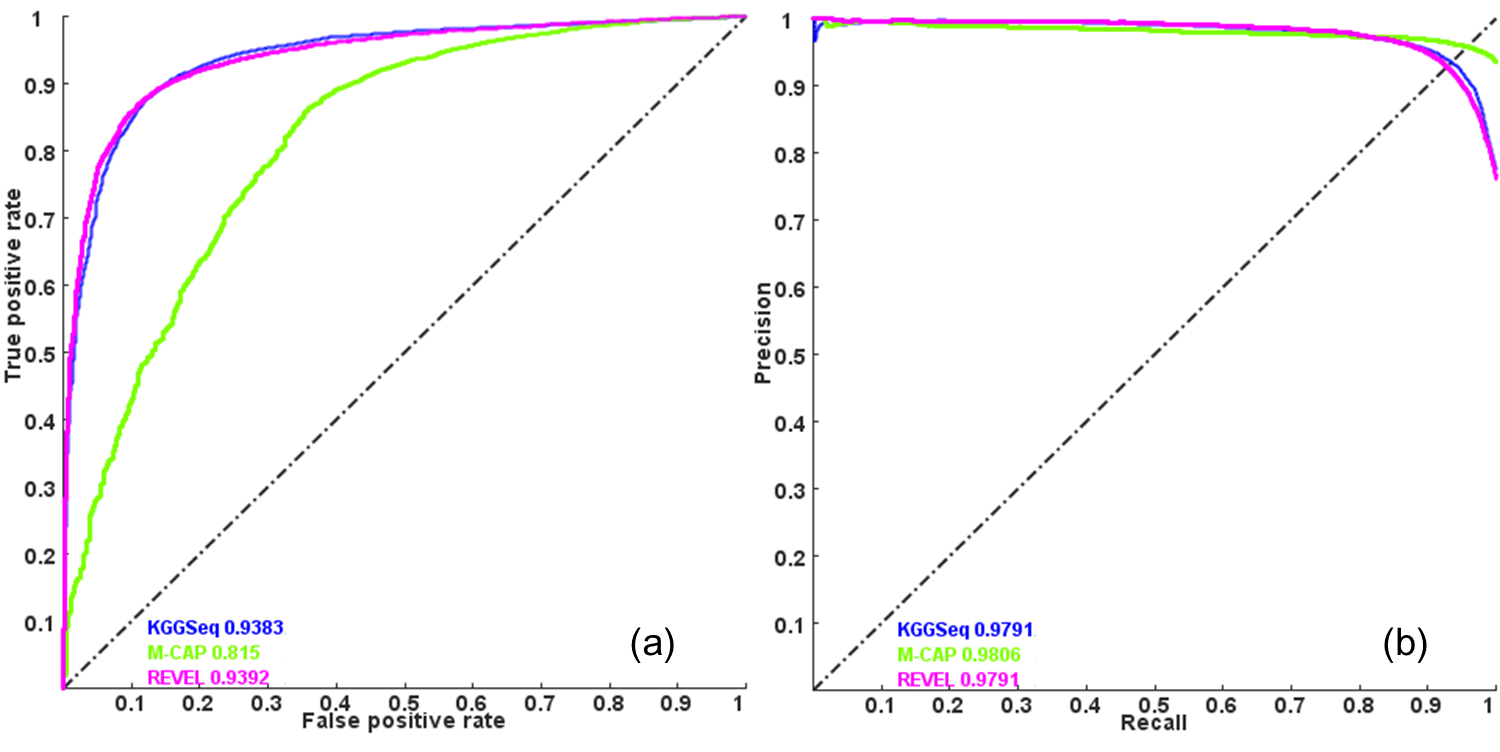
Figure: The performance comparison of KGGSeq´s pathogenic prediction with REVEL and M-CAP. Note: A) area under the curve of receiver operating characteristic, B)area under the curve of precision-recall. This plot is from KGGSeq's reference paper. Please read details in producing the plot in the paper .
On the other hand, one can FIX the prediction using a specified subset or full set of the 5 impact scores by option like --mendel-causing-predict 4,6,7
The coding for the functional or deleterious scores used in'--mendel-causing-predict'options is listed below:
| Coding | Method | Description (Mostly copied from dbNSFP) |
| 1 | SIFT | SIFT uses the 'Sorting Tolerant From Intolerant' (SIFT) algorithm to predict whether a single amino acid substitution affects protein function or not, based on the assumption that important amino acids in a protein sequence should be conserved throughout evolution and substitutions at highly conserved sites are expected to affect protein function.A small scoreindicates a high chance for a substitutionto damage the protein function. |
| 2 | Polyphen2_HDIV | Polyphen2 score based on HumDiv, i.e. hdiv_prob. The score ranges from 0 to 1, and the corresponding prediction is "probably damaging" if it is in [0.957,1]; "possibly damaging" if it is in [0.453,0.956]; "benign" if it is in [0,0.452]. Score cutoff for binary classification is 0.5, i.e. the prediction is "neutral" if the score is smaller than 0.5 and "deleterious" if the score is larger than 0.5. Multiple entries separated by ";" |
| 3 | Polyphen2_HVAR | Polyphen2 predicts the possible impact of an amino acid substitution on the structure and function of a human protein using straightforward physical and comparative considerations by an iterative greedy algorithm. In the present study, we use the original scores generated by the HumVar (instead ofHumDiv) trained model as it is preferred for the diagnosis of Mendelian diseases. The scores range from 0 to 1. A substitution with larger score has a higher possibility to damage the protein function. |
| 4 | LRT | LRT employed a likelihood ratio test to assess variant deleteriousness based on a comparative genomics data set of 32 vertebrate species. The identified deleterious mutations could disrupt highly conserved amino acids within protein-coding sequences, which are likely to be unconditionally deleterious.The scores range from 0 to 1. A larger score indicates a larger deleterious effect. |
| 5 | MutationTaster | MutationTaster assesses the impact of the disease-causing potential of a sequence variant by a naive Bayes classifier using multiple resources such as evolutionary conservation, splice-site changes, loss of protein features and changes that might affect mRNA level. The scores range from 0 to 1. The larger score suggests a higher probability to cause a human disease. |
| 6 | MutationAssessor | MutationAssessor "functional impact of a variant : predicted functional (high, medium), predicted non-functional (low, neutral)" Please refer to Reva et al. Nucl. Acids Res. (2011) 39(17):e118 for details |
| 7 | FATHMM | FATHMM default score (weighted for human inherited-disease mutations with Disease Ontology); If a score is smaller than -1.5 the corresponding NS is predicted as "D(AMAGING)"; otherwise it is predicted as "T(OLERATED)". If there's more than one scores associated with the same NS due to isoforms, the smallest score (most damaging) was used. Please refer to Shihab et al Hum. Mut. (2013) 34(1):57-65 for details |
| 8 | VEST3 | VEST 3.0 score. Score ranges from 0 to 1. The larger the score the more likely the mutation may cause functional change. In case there are multiple scores for the same variant, the largest score (most damaging) is presented. Please refer to Carter et al., (2013) BMC Genomics. 14(3) 1-16 for details. Please note this score is free for non-commercial use. For more details please refer to http://wiki.chasmsoftware.org/index.php/SoftwareLicense. Commercial users should contact the Johns Hopkins Technology Transfer office. |
| 9 | PROVEAN | PROVEAN score (PROVEANori). Scores range from -14 to 14. The smaller the score the more likely the SNP has damaging effect.. |
| 10 | CADD | Combined Annotation Dependent Depletion (CADD) score for funtional prediction of a SNP. Please refer to Kircher et al. (2014) Nature Genetics 46(3):310-5 for details. The larger the score the more likely the SNP has damaging effect. |
| 11 | GERP++_NR | Neutral rate |
| 12 | GERP++_RS | RS score, the larger the score, the more conserved the site |
| 13 | phastCons7way_vertebrate | phastCons conservation score based on the multiple alignments of 7 vertebrate genomes (including human). The larger the score, the more conserved the site. Scores range from 0 to 1. |
| 14 | SiPhy_29way_logOdds | SiPhy score based on 29 mammals genomes. The larger the score, the more conserved the site. Scores range from 0 to 37.9718 in dbNSFP. |
Note If you use this feature in any published work, please cite the following manuscript: Li et al. Predicting Mendelian disease-causing non-synonymous single nucleotide variants in exome sequencing studies. PLoS Genet. 2013 Jan;9(1):e1003143
The option will append the following fields to the output file:
...
Polyphen2_HDIV_pred: Polyphen2 prediction based on HumDiv, "D" ("probably damaging"),
"P" ("possibly damaging") and "B" ("benign"). Multiple entries separated by ";"
Polyphen2_HVAR_pred: Polyphen2 prediction based on HumVar, "D" ("probably damaging"),
"P" ("possibly damaging") and "B" ("benign"). Multiple entries separated by ";"
LRT_pred: Classification using LRT (D = deleterious, N = neutral,
or U = unknown)
MutationTaster_pred: Classification using MutationTaster (A =
disease_causing_automatic, D = disease_causing, N =
polymorphism, or P = polymorphism_automatic)
MutationAssessor_pred: MutationAssessor "functional impact of a variant :
predicted functional (high, medium), predicted non-functional (low, neutral)"
MetaSVM_pred: Prediction of an SVM based ensemble prediction score by Dong et al. [(2015) Human Molecular Genetics 24(8):2125-2137]."T(olerated)" or"D(amaging)".
MetaLR_pred: Prediction of a MetaLR based ensemble prediction score by Dong et al. [(2015) Human Molecular Genetics 24(8):2125-2137]."T(olerated)" or "D(amaging)".
clinvar_clnsig: clinical significance as to the clinvar data set; 2 - Benign, 3 - Likely benign, 4 - Likely pathogenic, 5 - Pathogenic, 6 - drug response, 7 - histocompatibility. A negative score means the the score is for the ref allele
clinvar_trait: the trait/disease the clinvar_clnsig referring to (Please see more description about the attributes at https://drive.google.com/file/d/0B60wROKy6OqcWllRZjZXM2Vuc2c/view
[...]
DiseaseCausalProb_ExoVarTrainedModel: Conditional probability of being Mendelian disease-causing
given the above prediction scores under a logistic regression
model trained by our dataset ExoVar.
IsRareDiseaseCausal_ExoVarTrainedModel: Classification using the logistic regression model
(Y = disease-causing or N = neutral)
BestCombinedTools:OptimalCutoff:TP:TN : The subset of original prediction tools (out of the 13 tools) used for the combined prediction by our Logistic Regression model which have the largest posterior probability among all possible combinatorial subsets: the cutoff leads to the maximal Matthews correlation coefficient (MCC): the corresponding true positive and true negative at the maximal MCC.
Note By default the option --mendel-causing-predict best is always switched on unless other prediction types are specified.
Predict high frequent somatic mutation potential in cancers
Predict non-synonyms highly frequent somatic-mutations of cancers by an integrative approach based on : --db-score dbnsfp --cancer-mut-predict
java -jar kggseq.jar --maf-file path/to/file1 --ped-file path/to/file2 --db-score dbnsfp --cancer-mut-predict
We built a model to predict high-frequent somatic mutation potential as prior weights. This was a random forest (ensemble of 500 decision trees) model trained by a large cancer somatic mutation database, COSMIC (V83). We collected 4,320 somatic mutation variants occurring over 15 times in primary cancer tissues to constitute a positive variant set in COSMIC(V83). A negative control variant set containing 258,846 somatic mutation variants was randomly sampled from the COSMIC as well. Each of the control variant occurred only once in primary cancer tissues. The predictors at each variant include 19 deleterious or conservation scores from the database
dbNSFP v3.5.
See the names of all tools in the following Figure and description the predictors in a
web page of dbNSFP v3.5.
The area under of the receiver operating characteristic curve of the random forest model was 79%, which was much better than a multivariate logistic regression model and individual predictors.
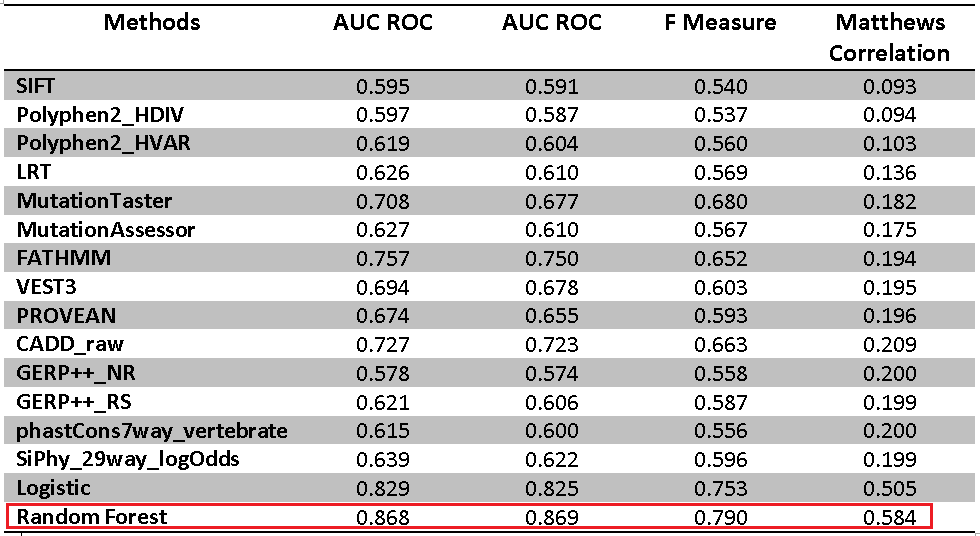
Table: The area under the curves (AUC) of receiver operating characteristic (ROC) curves of individual scores and combined score by the random forest model and Logistic regression model in a 10-fold cross-validation. As shown in the above table, the combined prediction by the random forest outperformed that by the Logistic regression.
The option will append the following fields to the output file:
...
IsHighMut_COSMICTrainedModel: Classification results by the random forest model
(Y = frequent somatic mutations potential or N = low somatic mutations potential)
RandomForestScore:Proportion of positive predictions in the random forest model in the benchmark dataset. It ranges from 0 to 1. The larger value, the more confident a positive prediction (Y).
NoteThe somatic mutations of patients can be input in VCF format:
java -jar kggseq.jar --vcf-file path/to/file1 --ped-file path/to/file2 --indiv-pair NONTUMOR.1:TUMOR.1,NONTUMOR.2:TUMOR.2 --genotype-filter 8 --cosmic-annot --db-score dbnsfp --cancer-mut-predict
NoteMore descriptions about this model can been seen in our paper:
Jiang et al. WITER: a powerful method for estimation of cancer-driver genes using a weighted iterative regression modelling background mutation counts. Nucleic Acids Research (In press)
Predicting complex disease-causing variants
Predict regulatory or pathogenic potential of complex diseases at non-coding variants by different models.
Predict regulatory variants by 10 functional scores at non-coding variants: --db-score dbncfp_known [or dbncfp_all] --regulatory-causing-predict
java -jar kggseq.jar --vcf-file path/to/file1 --db-score dbncfp_known --regulatory-causing-predict all
Use 10 existing functional prediction scores (See above table) to RE-predict whether a SNV will potentially be regulatory. By default, KGGSeq uses all scores for a combinatorial prediction. On the other hand, one can FIX the prediction using any specified subset (>2) or full set (all) of the impact scores by option like --regulatory-causing-predict 1,6,8,10.
The existing functional prediction scores at non-coding variants are listed below:
| Coding | Method | Description |
| 1 | GWAVA_Region | GWAVA uses the random forest algorithm to build three classifiers using all available annotations to discriminate between the disease variants and variants from each of the three control sets. This control set first was composed of all 1KG variants in the 1 kb surrounding each of the HGMD variants. |
| 2 | GWAVA_TSS | GWAVA uses the random forest algorithm to build three classifiers using all available annotations to discriminate between the disease variants and variants from each of the three control sets. This control set first was matched for distance to the nearest TSS genome-wide. |
| 3 | GWAVA_Unmatched | GWAVA uses the random forest algorithm to build three classifiers using all available annotations to discriminate between the disease variants and variants from each of the three control sets. This control set first was constructed from a random selection of SNVs from across the genome in order to sample overall background. |
| 4 | CADD_CScore | "Raw" CADD scores come straight from the CADD model, and are interpretable as the extent to which the annotation profile for a given variant suggests that that variant is likely to be "observed" (negative values) vs "simulated" (positive values). These values have no absolute unit of meaning and are incomparable across distinct annotation combinations, training sets, or model parameters. However, raw values do have relative meaning, with higher values indicating that a variant is more likely to be simulated (or "not observed") and therefore more likely to have deleterious effects. |
| 5 | DANN | DANN uses the same feature set and training data as CADD to train a deep neural network (DNN). DNNs can capture nonlinear relationships among features and are better suited than SVMs for problems with a large number of samples and features. |
| 6 | FATHMM-MKL | FATHMM-MKL uses MKL classifier to predict the functional consequences of both coding and non-coding sequence variants from various genomic annotations and weights the significance of each component annotation source. |
| 7 | FunSeq | FunSeq filters mutations overlapping 1000 Genomes variants and then prioritizes those in regions under strong selection (sensitive and ultrasensitive), breaking TF motifs, and those associated with hubs. It can score the deleterious potential of variants in single or multiple genomes. The scores for each noncoding variant vary from 0 to 6, with 6 corresponding to maximum deleterious effect. When multiple tumor genomes are given as input, FunSeq also identifies recurrent mutations in the same element. |
| 8 | FunSeq2 | FunSeq2 is originally to annotate and prioritize somatic alterations integrating various resources from genomic and cancer studies. The framework consists of two components: (1) data context from uniformly processing large-scale datasets; and (2) a high-throughput variant prioritization pipeline. FunSeq2 can also be used to prioritize noncoding genetic variants. |
| 9 | GWAS3D | GWAS3D systematically assesses the genetic variants that could affect regulatory elements, by integrating annotations from cell type-specific chromatin states, epigenetic modifications, sequence motifs and cross-species conservation. It combines the original GWAS signal, risk haplotype, binding affinity significance and conservation information to prioritize the leading variants, and infer the putative causal variant in the LD of leading variant. |
| 10 | SuRFR | SuRFR integrates functional annotation and prior biological knowledge to prioritise candidate functional variants by regression model. It introduces novel training and validation datasets that i) capture the regional heterogeneity of genomic annotation better than previously applied approaches, and ii) facilitate understanding of which annotations are most important for discriminating different classes of functionally relevant variants from background variants. |
If you have a lot of variants without annotation of existing tools, you can use the whole genome annotation dataset, --db-score dbncfp_all. However, you have to manually download the file from hgXX_all_SNV_dbNCFP.gz by efficient tools (e.g. FileZilla) and put it into the folder of KGGSeqFolder/resources/hgXX/hgXX_all_SNV_dbNCFP.gz.
Besides the above existing functional prediction scores, this option will append the following fields to the output file:
BF:Bayes factor (BF) that compares the two probability models, in which the null hypothesis is that the variant is neutral, and the alternative hypothesis is that the variant is causal.
Composite_Prob: the overall probability of the variant being regulatory-causal, which is calculated by multiplying the probabilities of being causal of multiple scores.
Reference: Mulin Jun Li et al. Predicting regulatory variants with composite statistic. Bioinformatics. 2016 Sep 15;32(18):2729-36.
Note <argument>: --regulatory-causing-predict is described in last selection (composite strategy).
Predict pathogenic variants by adding cell-type specific regulatory epigenomic markers: --db-score dbncfp_known [or dbncfp_all] --regulatory-causing-predict all --celljava -jar kggseq.jar --vcf-file path/to/file1 --db-score dbncfp_known --regulatory-causing-predict all --cell GM12878
Assigning a cell type, KGGSeq uses a logit model to measure the probability of regulatory causality for given variants in selected condition. It finally combine the above composite model and context-dependent model into an unified model to estimate the posterior regulatory probability in a specific cell type/tissue. ftp://jjwanglab.org/PRVCS/dbNCFP/dbNCFP_hg19.ANN.bgz
If you have a lot of variants without annotation of existing tools (rare/de novo/somatic variants), you can use the whole genome annotation dataset, --db-score dbncfp_all. However, you have to manually download the file from hgXX_all_SNV_dbNCFP.gz by efficient tools (e.g. FileZilla) and put it into the folder of KGGSeqFolder/resources/hgXX/hgXX_all_SNV_dbNCFP.gz.
KGGSeq supports 16 ENCODE cell types as follows:
| Coding | Tissue | Description |
| A549 | Epithelium | epithelial cell line derived from a lung carcinoma tissue. (PMID: 175022), "This line was initiated in 1972 by D.J. Giard, et al. through explant culture of lung carcinomatous tissue from a 58-year-old caucasian male." - ATCC, newly promoted to tier 2: not in 2011 analysis. |
| CD14 | Monocytes | Monocytes-CD14+ are CD14-positive cells from human leukapheresis production, from donor RO 01746 (draw 1 ID is RO 01746, draw 2 ID is RO 01826), newly promoted to tier 2: not in 2011 analysis. |
| GM12878 | Blood | B-lymphocyte, lymphoblastoid, International HapMap Project - CEPH/Utah - European Caucasion, Epstein-Barr Virus. |
| H1-hESC | Embryonic stem cell | embryonic stem cells. |
| HMEC | Breast | mammary epithelial cells. |
| HSMM | Muscle | skeletal muscle myoblasts. |
| HSMMT | Muscle | HSMM cell derived skeletal muscle myotubes cell line. |
| HUVEC | Vessel | umbilical vein endothelial cells. |
| HeLa-S3 | Cervix | cervical carcinoma. |
| HepG2 | Liver | hepatocellular carcinoma. |
| IMR90 | Lung | fetal lung fibroblasts, newly promoted to tier 2: not in 2011 analysis. |
| K562 | Blood | leukemia, "The continuous cell line K-562 was established by Lozzio and Lozzio from the pleural effusion of a 53-year-old female with chronic myelogenous leukemia in terminal blast crises." - ATCC. |
| NH-A | Brain | astrocytes (also called Astrocy). |
| NHDF | Skin | dermal fibroblasts from temple / breast |
| NHEK | Skin | epidermal keratinocytes. |
| NHLF | Lung | lung fibroblasts. |
KGGSeq also supports 127 RoadMap human reference epigenomes :
java -jar kggseq.jar --vcf-file path/to/file1 --db-score dbncfp_known --regulatory-causing-predict all --cell E116
| Coding | Lineage Group | Epigenome Mnemonic | Epigenome Name | Anatomy | Type |
| E001 | ESC | ESC.I3 | ES-I3 Cell Line | ESC | CellLine |
| E002 | ESC | ESC.WA7 | ES-WA7 Cell Line | ESC | CellLine |
| E003 | ESC | ESC.H1 | H1 Cell Line | ESC | CellLine |
| E004 | ES-deriv | ESDR.H1.BMP4.MESO | H1 BMP4 Derived Mesendoderm Cultured Cells | ESC_DERIVED | CellLineDerived |
| E005 | ES-deriv | ESDR.H1.BMP4.TROP | H1 BMP4 Derived Trophoblast Cultured Cells | ESC_DERIVED | CellLineDerived |
| E006 | ES-deriv | ESDR.H1.MSC | H1 Derived Mesenchymal Stem Cells | ESC_DERIVED | CellLineDerived |
| E007 | ES-deriv | ESDR.H1.NEUR.PROG | H1 Derived Neuronal Progenitor Cultured Cells | ESC_DERIVED | CellLineDerived |
| E008 | ESC | ESC.H9 | H9 Cell Line | ESC | CellLine |
| E009 | ES-deriv | ESDR.H9.NEUR.PROG | H9 Derived Neuronal Progenitor Cultured Cells | ESC_DERIVED | CellLineDerived |
| E010 | ES-deriv | ESDR.H9.NEUR | H9 Derived Neuron Cultured Cells | ESC_DERIVED | CellLineDerived |
| E011 | ES-deriv | ESDR.CD184.ENDO | hESC Derived CD184+ Endoderm Cultured Cells | ESC_DERIVED | CellLineDerived |
| E012 | ES-deriv | ESDR.CD56.ECTO | hESC Derived CD56+ Ectoderm Cultured Cells | ESC_DERIVED | CellLineDerived |
| E013 | ES-deriv | ESDR.CD56.MESO | hESC Derived CD56+ Mesoderm Cultured Cells | ESC_DERIVED | CellLineDerived |
| E014 | ESC | ESC.HUES48 | HUES48 Cell Line | ESC | CellLine |
| E015 | ESC | ESC.HUES6 | HUES6 Cell Line | ESC | CellLine |
| E016 | ESC | ESC.HUES64 | HUES64 Cell Line | ESC | CellLine |
| E017 | IMR90 | LNG.IMR90 | IMR90 fetal lung fibroblasts Cell Line | LUNG | CellLine |
| E018 | iPSC | IPSC.15b | iPS-15b Cell Line | IPSC | CellLine |
| E019 | iPSC | IPSC.18 | iPS-18 Cell Line | IPSC | CellLine |
| E020 | iPSC | IPSC.20B | iPS-20b Cell Line | IPSC | CellLine |
| E021 | iPSC | IPSC.DF.6.9 | iPS DF 6.9 Cell Line | IPSC | CellLine |
| E022 | iPSC | IPSC.DF.19.11 | iPS DF 19.11 Cell Line | IPSC | CellLine |
| E023 | Mesench | FAT.MSC.DR.ADIP | Mesenchymal Stem Cell Derived Adipocyte Cultured Cells | FAT | CellLineDerived |
| E024 | ESC | ESC.4STAR | Cell Line | ESC | CellLine |
| E025 | Mesench | FAT.ADIP.DR.MSC | Adipose Derived Mesenchymal Stem Cell Cultured Cells | FAT | PrimaryCell |
| E026 | Mesench | STRM.MRW.MSC | Bone Marrow Derived Cultured Mesenchymal Stem Cells | NECTIVE | PrimaryCell |
| E027 | Epithelial | BRST.MYO | Breast Myoepithelial Primary Cells | BREAST | PrimaryCell |
| E028 | Epithelial | BRST.HMEC.35 | Breast variant Human Mammary Epithelial Cells (vHMEC) | BREAST | PrimaryCell |
| E029 | HSC & B-cell | BLD.CD14.PC | Primary monocytes from peripheral blood | BLOOD | PrimaryCell |
| E030 | HSC & B-cell | BLD.CD15.PC | Primary neutrophils from peripheral blood | BLOOD | PrimaryCell |
| E031 | HSC & B-cell | BLD.CD19.CPC | Primary B cells from cord blood | BLOOD | PrimaryCell |
| E032 | HSC & B-cell | BLD.CD19.PPC | Primary B cells from peripheral blood | BLOOD | PrimaryCell |
| E033 | Blood & T-cell | BLD.CD3.CPC | Primary T cells from cord blood | BLOOD | PrimaryCell |
| E034 | Blood & T-cell | BLD.CD3.PPC | Primary T cells from peripheral blood | BLOOD | PrimaryCell |
| E035 | HSC & B-cell | BLD.CD34.PC | Primary hematopoietic stem cells | BLOOD | PrimaryCell |
| E036 | HSC & B-cell | BLD.CD34.CC | Primary hematopoietic stem cells short term culture | BLOOD | PrimaryCell |
| E037 | Blood & T-cell | BLD.CD4.MPC | Primary T helper memory cells from peripheral blood 2 | BLOOD | PrimaryCell |
| E038 | Blood & T-cell | BLD.CD4.NPC | Primary T helper naive cells from peripheral blood | BLOOD | PrimaryCell |
| E039 | Blood & T-cell | BLD.CD4.CD25M.CD45RA.NPC | Primary T helper naive cells from peripheral blood | BLOOD | PrimaryCell |
| E040 | Blood & T-cell | BLD.CD4.CD25M.CD45RO.MPC | Primary T helper memory cells from peripheral blood 1 | BLOOD | PrimaryCell |
| E041 | Blood & T-cell | BLD.CD4.CD25M.IL17M.PL.TPC | Primary T helper cells PMA-I stimulated | BLOOD | PrimaryCell |
| E042 | Blood & T-cell | BLD.CD4.CD25M.IL17P.PL.TPC | Primary T helper 17 cells PMA-I stimulated | BLOOD | PrimaryCell |
| E043 | Blood & T-cell | BLD.CD4.CD25M.TPC | Primary T helper cells from peripheral blood | BLOOD | PrimaryCell |
| E044 | Blood & T-cell | BLD.CD4.CD25.CD127M.TREGPC | Primary T regulatory cells from peripheral blood | BLOOD | PrimaryCell |
| E045 | Blood & T-cell | BLD.CD4.CD25I.CD127.TMEMPC | Primary T cells effector/memory enriched from peripheral blood | BLOOD | PrimaryCell |
| E046 | HSC & B-cell | BLD.CD56.PC | Primary Natural Killer cells from peripheral blood | BLOOD | PrimaryCell |
| E047 | Blood & T-cell | BLD.CD8.NPC | Primary T killer naive cells from peripheral blood | BLOOD | PrimaryCell |
| E048 | Blood & T-cell | BLD.CD8.MPC | Primary T killer memory cells from peripheral blood | BLOOD | PrimaryCell |
| E049 | Mesench | STRM.CHON.MRW.DR.MSC | Mesenchymal Stem Cell Derived Chondrocyte Cultured Cells | NECTIVE | PrimaryCell |
| E050 | HSC & B-cell | BLD.MOB.CD34.PC.F | Primary hematopoietic stem cells G-CSF-mobilized Female | BLOOD | PrimaryCell |
| E051 | HSC & B-cell | BLD.MOB.CD34.PC.M | Primary hematopoietic stem cells G-CSF-mobilized Male | BLOOD | PrimaryCell |
| E052 | Myosat | MUS.SAT | Muscle Satellite Cultured Cells | MUSCLE | PrimaryCell |
| E053 | Neurosph | BRN.CRTX.DR.NRSPHR | Cortex derived primary cultured neurospheres | BRAIN | PrimaryCell |
| E054 | Neurosph | BRN.GANGEM.DR.NRSPHR | Ganglion Eminence derived primary cultured neurospheres | BRAIN | PrimaryCell |
| E055 | Epithelial | SKIN.PEN.FRSK.FIB.01 | Foreskin Fibroblast Primary Cells skin01 | SKIN | PrimaryCell |
| E056 | Epithelial | SKIN.PEN.FRSK.FIB.02 | Foreskin Fibroblast Primary Cells skin02 | SKIN | PrimaryCell |
| E057 | Epithelial | SKIN.PEN.FRSK.KER.02 | Foreskin Keratinocyte Primary Cells skin02 | SKIN | PrimaryCell |
| E058 | Epithelial | SKIN.PEN.FRSK.KER.03 | Foreskin Keratinocyte Primary Cells skin03 | SKIN | PrimaryCell |
| E059 | Epithelial | SKIN.PEN.FRSK.MEL.01 | Foreskin Melanocyte Primary Cells skin01 | SKIN | PrimaryCell |
| E061 | Epithelial | SKIN.PEN.FRSK.MEL.03 | Foreskin Melanocyte Primary Cells skin03 | SKIN | PrimaryCell |
| E062 | Blood & T-cell | BLD.PER.MONUC.PC | Primary mononuclear cells from peripheral blood | BLOOD | PrimaryCell |
| E063 | Adipose | FAT.ADIP.NUC | Adipose Nuclei | FAT | PrimaryTissue |
| E065 | Heart | VAS.AOR | Aorta | VASCULAR | PrimaryTissue |
| E066 | Other | LIV.ADLT | Liver | LIVER | PrimaryTissue |
| E067 | Brain | BRN.ANG.GYR | Brain Angular Gyrus | BRAIN | PrimaryTissue |
| E068 | Brain | BRN.ANT.CAUD | Brain Anterior Caudate | BRAIN | PrimaryTissue |
| E069 | Brain | BRN.CING.GYR | Brain Cingulate Gyrus | BRAIN | PrimaryTissue |
| E070 | Brain | BRN.GRM.MTRX | Brain Germinal Matrix | BRAIN | PrimaryTissue |
| E071 | Brain | BRN.HIPP.MID | Brain Hippocampus Middle | BRAIN | PrimaryTissue |
| E072 | Brain | BRN.INF.TMP | Brain Inferior Temporal Lobe | BRAIN | PrimaryTissue |
| E073 | Brain | BRN.DL.PRFRNTL.CRTX | Brain Dorsolateral Prefrontal Cortex | BRAIN | PrimaryTissue |
| E074 | Brain | BRN.SUB.NIG | Brain Substantia Nigra | BRAIN | PrimaryTissue |
| E075 | Digestive | GI.CLN.MUC | Colonic Mucosa | GI_COLON | PrimaryTissue |
| E076 | Sm. Muscle | GI.CLN.SM.MUS | Colon Smooth Muscle | GI_COLON | PrimaryTissue |
| E077 | Digestive | GI.DUO.MUC | Duodenum Mucosa | GI_DUODENUM | PrimaryTissue |
| E078 | Sm. Muscle | GI.DUO.SM.MUS | Duodenum Smooth Muscle | GI_DUODENUM | PrimaryTissue |
| E079 | Digestive | GI.ESO | Esophagus | S | PrimaryTissue |
| E080 | Other | ADRL.GLND.FET | Fetal Adrenal Gland | ADRENAL | PrimaryTissue |
| E081 | Brain | BRN.FET.M | Fetal Brain Male | BRAIN | PrimaryTissue |
| E082 | Brain | BRN.FET.F | Fetal Brain Female | BRAIN | PrimaryTissue |
| E083 | Heart | HRT.FET | Fetal Heart | HEART | PrimaryTissue |
| E084 | Digestive | GI.L.INT.FET | Fetal Intestine Large | GI_INTESTINE | PrimaryTissue |
| E085 | Digestive | GI.S.INT.FET | Fetal Intestine Small | GI_INTESTINE | PrimaryTissue |
| E086 | Other | KID.FET | Fetal Kidney | KIDNEY | PrimaryTissue |
| E087 | Other | PANC.ISLT | Pancreatic Islets | PANCREAS | PrimaryTissue |
| E088 | Other | LNG.FET | Fetal Lung | LUNG | PrimaryTissue |
| E089 | Muscle | MUS.TRNK.FET | Fetal Muscle Trunk | MUSCLE | PrimaryTissue |
| E090 | Muscle | MUS.LEG.FET | Fetal Muscle Leg | MUSCLE_LEG | PrimaryTissue |
| E091 | Other | PLCNT.FET | Placenta | PLACENTA | PrimaryTissue |
| E092 | Digestive | GI.STMC.FET | Fetal Stomach | GI_STOMACH | PrimaryTissue |
| E093 | Thymus | THYM.FET | Fetal Thymus | THYMUS | PrimaryTissue |
| E094 | Digestive | GI.STMC.GAST | Gastric | GI_STOMACH | PrimaryTissue |
| E095 | Heart | HRT.VENT.L | Left Ventricle | HEART | PrimaryTissue |
| E096 | Other | LNG | Lung | LUNG | PrimaryTissue |
| E097 | Other | OVRY | Ovary | OVARY | PrimaryTissue |
| E098 | Other | PANC | Pancreas | PANCREAS | PrimaryTissue |
| E099 | Other | PLCNT.AMN | Placenta Amnion | PLACENTA | PrimaryTissue |
| E100 | Muscle | MUS.PSOAS | Psoas Muscle | MUSCLE | PrimaryTissue |
| E101 | Digestive | GI.RECT.MUC.29 | Rectal Mucosa Donor 29 | GI_RECTUM | PrimaryTissue |
| E102 | Digestive | GI.RECT.MUC.31 | Rectal Mucosa Donor 31 | GI_RECTUM | PrimaryTissue |
| E103 | Sm. Muscle | GI.RECT.SM.MUS | Rectal Smooth Muscle | GI_RECTUM | PrimaryTissue |
| E104 | Heart | HRT.ATR.R | Right Atrium | HEART | PrimaryTissue |
| E105 | Heart | HRT.VNT.R | Right Ventricle | HEART | PrimaryTissue |
| E106 | Digestive | GI.CLN.SIG | Sigmoid Colon | GI_COLON | PrimaryTissue |
| E107 | Muscle | MUS.SKLT.M | Skeletal Muscle Male | MUSCLE | PrimaryTissue |
| E108 | Muscle | MUS.SKLT.F | Skeletal Muscle Female | MUSCLE | PrimaryTissue |
| E109 | Digestive | GI.S.INT | Small Intestine | GI_INTESTINE | PrimaryTissue |
| E110 | Digestive | GI.STMC.MUC | Stomach Mucosa | GI_STOMACH | PrimaryTissue |
| E111 | Sm. Muscle | GI.STMC.MUS | Stomach Smooth Muscle | GI_STOMACH | PrimaryTissue |
| E112 | Thymus | THYM | Thymus | THYMUS | PrimaryTissue |
| E113 | Other | SPLN | Spleen | SPLEEN | PrimaryTissue |
| E114 | ENCODE | LNG.A549.ETOH002.CNCR | A549 EtOH 0.02pct Lung Carcinoma Cell Line | LUNG | CellLine_Cancer |
| E115 | ENCODE | BLD.DND41.CNCR | Dnd41 TCell Leukemia Cell Line | BLOOD | CellLine_Cancer |
| E116 | ENCODE | BLD.GM12878 | GM12878 Lymphoblastoid Cell Line | BLOOD | CellLine |
| E117 | ENCODE | CRVX.HELAS3.CNCR | HeLa-S3 Cervical Carcinoma Cell Line | CERVIX | CellLine_Cancer |
| E118 | ENCODE | LIV.HEPG2.CNCR | HepG2 Hepatocellular Carcinoma Cell Line | LIVER | CellLine_Cancer |
| E119 | ENCODE | BRST.HMEC | HMEC Mammary Epithelial Primary Cells | BREAST | CellLine |
| E120 | ENCODE | MUS.HSMM | HSMM Skeletal Muscle Myoblasts Cell Line | MUSCLE | CellLine |
| E121 | ENCODE | MUS.HSMMT | HSMM cell derived Skeletal Muscle Myotubes Cell Line | MUSCLE | CellLine |
| E122 | ENCODE | VAS.HUVEC | HUVEC Umbilical Vein Endothelial Cells Cell Line | VASCULAR | CellLine |
| E123 | ENCODE | BLD.K562.CNCR | K562 Leukemia Cell Line | BLOOD | CellLine |
| E124 | ENCODE | BLD.CD14.MONO | Monocytes-CD14+ RO01746 Cell Line | BLOOD | CellLine |
| E125 | ENCODE | BRN.NHA | NH-A Astrocytes Cell Line | BRAIN | CellLine |
| E126 | ENCODE | SKIN.NHDFAD | NHDF-Ad Adult Dermal Fibroblast Primary Cells | SKIN | CellLine |
| E127 | ENCODE | SKIN.NHEK | NHEK-Epidermal Keratinocyte Primary Cells | SKIN | CellLine |
| E128 | ENCODE | LNG.NHLF | NHLF Lung Fibroblast Primary Cells | LUNG | CellLine |
| E129 | ENCODE | BONE.OSTEO | Osteoblast Primary Cells | BONE | CellLine |
BF: Bayes factor
Composite_Prob:Posterior probability of being regualtory given selected functional prediction scores.
Cell_Prob: Cell type-specific regulatory potential.
Combine_Prob: Combined posterior regulatory probability.
Note Epigenomes of some specific marks are missing in some tissues/cells, which may affect the prediction. We will use imputed epigenomes to handle this missing data problem soon!
Figure: Using GWAS fine mapped SNPs and 127 recently profiled human epigenomes, we showed that our context-dependent score can comprehensively depict the phenotypic cell type specificity.
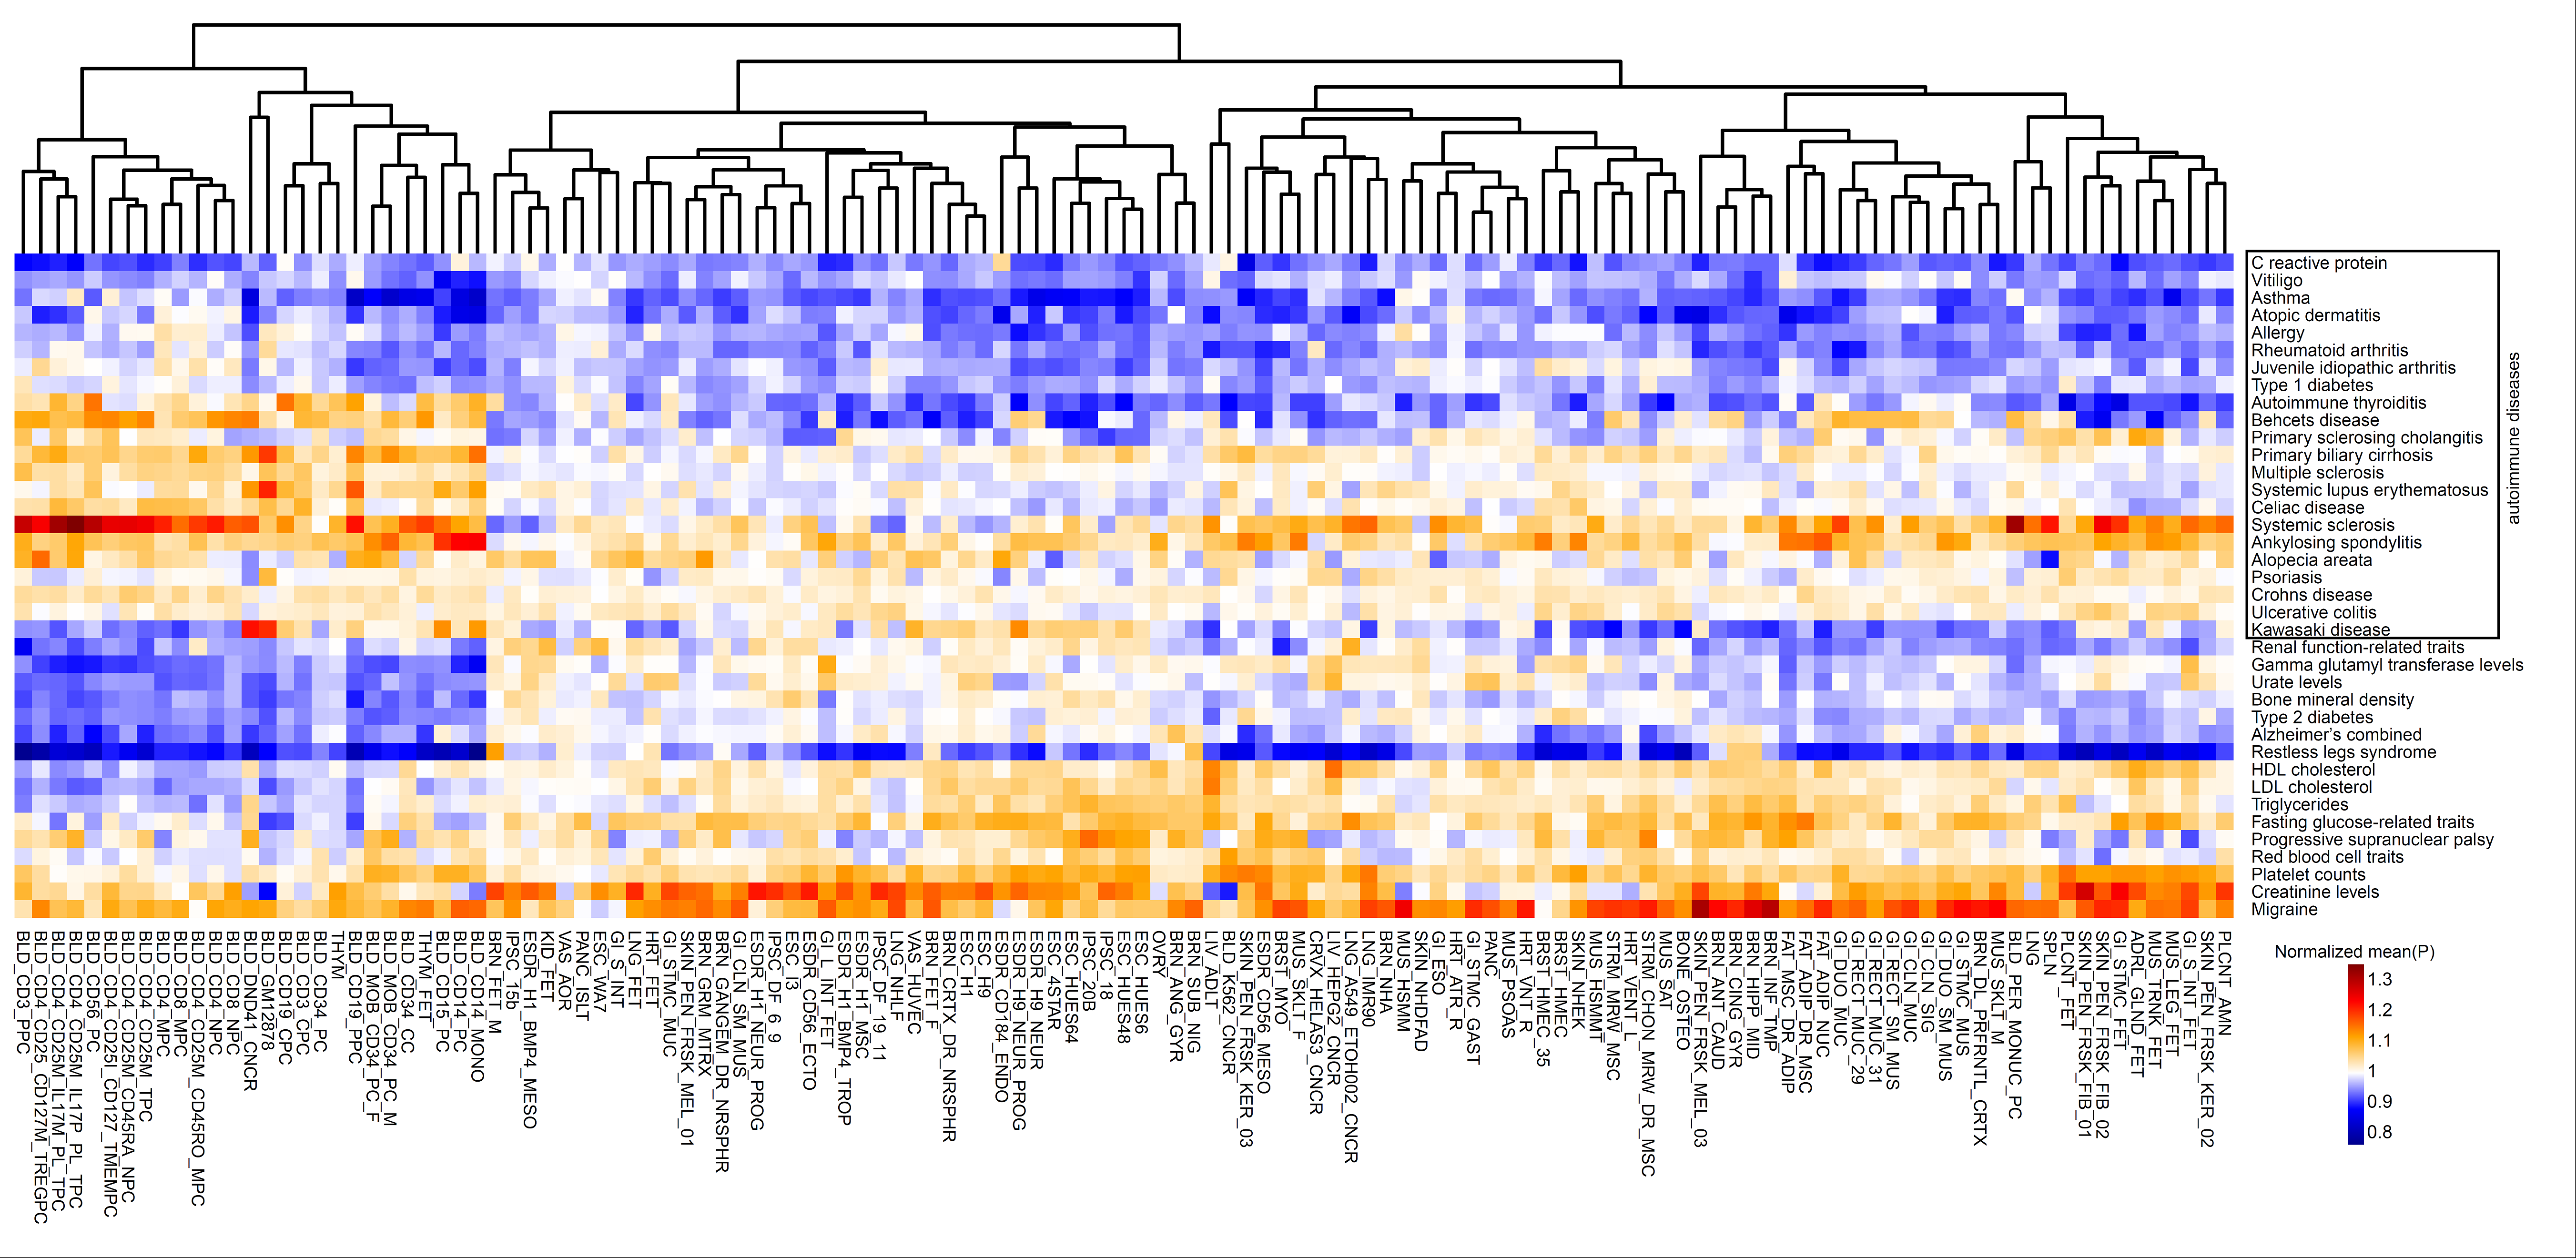
Reference: Mulin Jun Li et al. cepip: context-dependent epigenomic weighting for prioritization of regulatory variants and disease-associated genes, Genome Biology (2017) 18:52
![]() Gene feature specific model --db-score dbncfp_known [or dbncfp_all] --ldgf-func-predict
Gene feature specific model --db-score dbncfp_known [or dbncfp_all] --ldgf-func-predict
java -jar kggseq.jar --vcf-file path/to/file1 --db-score dbncfp_known --ldgf-func-predict --buildver hg19
1) Annotate non-coding variants by above 10 existing functional prediction scores (See above table) in a known variant dataset and 2) jointly predict the functions importance by a new statistical model (linkage disequilibrium expanded and gene feature specific model). The known dataset contains around 110 million variants from multiple high throughput sequencing resources, including the 1000 Genomes Project Phase 3, UK10K Project, ESP6500 Project and ExAC database. The joint prediction also uses over 700 epigenomic markers for open chromatin, transcription factor binding, histone modification, RNA polymerase binding, and DNA methylation.
If you have a lot of variants without annotation of existing tools, you can use the whole genome annotation dataset, --db-score dbncfp_all. However, you have to manually download the file from hgXX_all_SNV_dbNCFP.gz by efficient tools (e.g. FileZilla) and put it into the folder of KGGSeqFolder/resources/hgXX/hgXX_all_SNV_dbNCFP.gz.
Note Predictions at variants with missing scores at specified methods will use population mean of corresponding method!
Note Add the option tag --verbose-noncoding to show all detailed features used in the pathogenic prediction. However, this will consume a lot of memory!
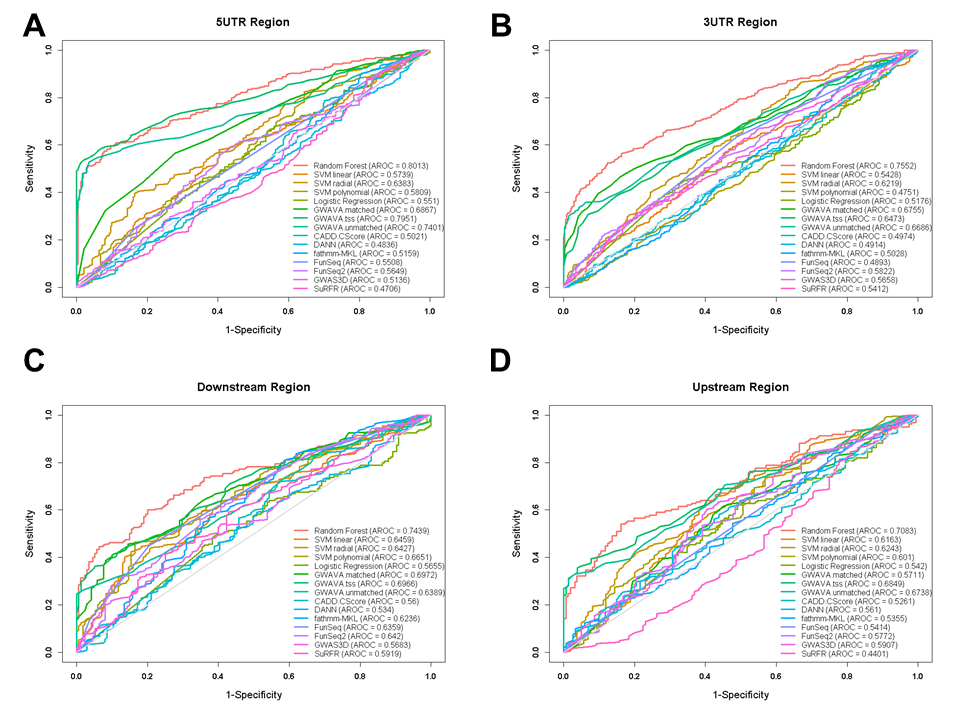
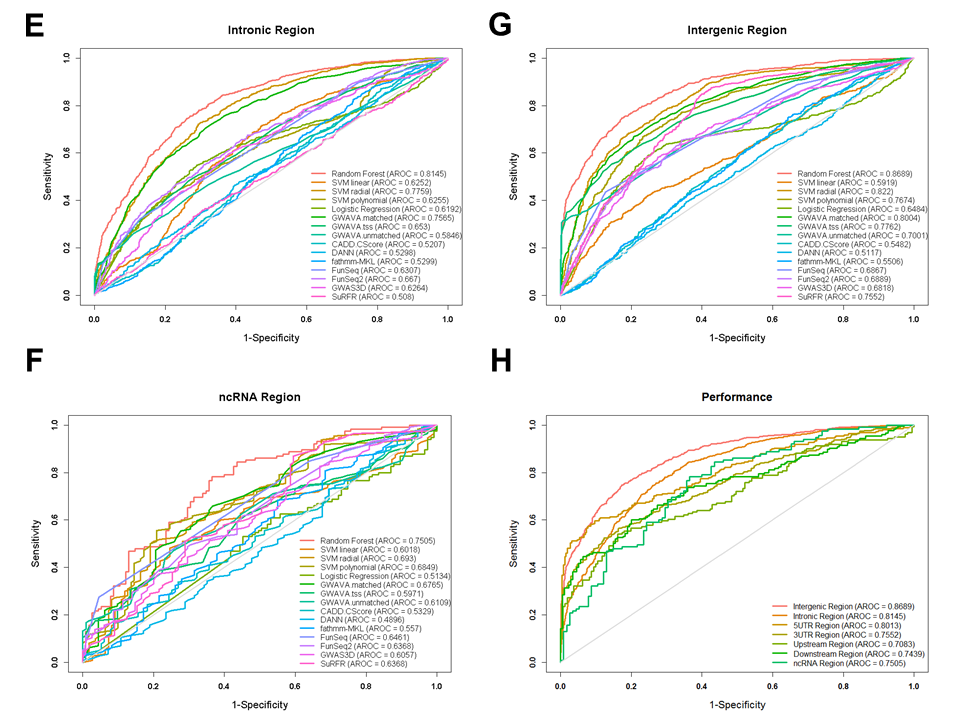
Figure: Receiver operating characteristic (ROC) curves for performances from different gene feature model.
Besides the above existing functional prediction scores, this option will append the following fields to the output file:
IsComplexDiseasePathogenic: whether the variant is predicted to be pathogenic by the model trained with known pathogenic variants and neutral control variants.
RandomForestScore: the pathogenic scores of the random forest prediction model.
Reference: Pan et al. An improved functional prediction by linkage disequilibrium expanded and gene feature specific scores at non-coding variants. (Submitted)
Prediction at gene
Pathogenicity
![]() Predict genes’ pathogenicity: --patho-gene-predict
Predict genes’ pathogenicity: --patho-gene-predict
java -jar kggseq.jar --vcf-file path/to/file1 --ped-file path/to/file2 --out path/to/prefixname --excel --db-gene refgene --patho-gene-predict
Gene-based pathogenicity estimation was developed for Autosomal Dominant (AD), Autosomal Recessive (AR), X chromosome linked (XL) and Paediatric diseases (PAE).
By using random forest approach to combine various important gene characteristics with six existing gene prioritization methods for disease causal genes in Clinical Genomic Database, the inheritance-specific pathogenicity prioritization (ISPP) could be estimated.
The higher score indicates the more similar molecular characteristics to the known disease causal genes under the corresponding inheritance mode. The six existing gene prioritization methods are Haploinsufficiency (HI), Recessive (REC), Network centrality (NET), Genic Intolerance (RVIS), Gene Damage Index (GDI) and Gene Constraint score (CONS).
The output is a series of pathogenic prediction scores for each gene. By comparing all ISPP scores of each gene, the possible inheritance mode and corresponding pathogenicity could be estimated. Please see the example on Table 1 of ISPP paper
ISPP_AD: Inheritance specific gene pathogenicity for Dominant diseases
ISPP_AR: Inheritance specific gene pathogenicity for Recessive diseases
ISPP_XL: Inheritance specific gene pathogenicity for X chromosome linked diseases
HI: Gene level haploinsufficiency estimation by Ni Huang et al
REC: A model to estimate the probability that a mutation causes a recessive disease by Daniel G. MacArthur et al.
NET: Gene centrality and indispensability in various protein-protein interactions and regulatory networks by Ekta Khurana et al.
RVIS: Residual Variation Intolerance Score , a gene score based module intended to help in the interpretation of human sequence data by Slave Petrovski et al.
GDI: Gene Damage Index (GDI) by Itan Y et al.
CONS: De novo mutation effectiveness prediction by Kaitlin E Samocha et al.
Reference: Jacob Hsu et al. Inheritance Modes Specific Pathogenicity Prioritization (ISPP) for Human Protein Coding Genes. Bioinformatics. 2016 Oct 15;32(20):3065-3071.
Phenotype Mining
![]() Mine the phenotype of disease: --phenotype-term searchTerm and --phenolyzer-prediction
Mine the phenotype of disease: --phenotype-term searchTerm and --phenolyzer-prediction
java -jar kggseq.jar --vcf-file path/to/file1 --ped-file path/to/file2 --out path/to/prefixname --excel --db-gene refgene --phenotype-term searchTerm1,searchTerm2 --phenolyzer-prediction
KGGseq has integrated the advanced tool phenolyzer as a plugin to implement the function of phenoytpe mining and predection. The score marked by phenolyer will by used to annotate the related genes in the output file.
NoteTo run Phenolyzer, your computer need install Perl. Please read the installation instructions.
Tissue-specific Expression
![]() Tissues or cell-types where the transcripts of genes are specifically expressed: --tissue-spec-annot
Tissues or cell-types where the transcripts of genes are specifically expressed: --tissue-spec-annot
java -jar kggseq.jar --vcf-file path/to/file1 --ped-file path/to/file2 --out path/to/prefixname --excel --db-gene refgene --tissue-spec-annot
Annotate genes with tissues or cell-types in which the transcripts of genes are specifically expressed. The tissue and cell-types are produced by a robust z-score approach for tissue-specific expression with the usage of GTEx RNA-sequencing data (version 7) at 52 tissues/cell-types. The tissues or cell-types are collected here as their tissue or cell-type specific expression p-values are less than 1E-6. See detail in REZ.
TissueWithSpecificExpression: the transcripts and tissues or cell-types where it is pecifically expressed. Multiple tissues and cell-types are delimited by commas and multiple transcripts are delimited by semicolons.
Statistical tests
Cancer-driver gene mutation burden test by Iterative zero-truncated negative-binomial regression (ITER) based on somatic mutations
java -jar kggseq.jar --maf-file path/to/file1.maf --out path/to/prefixname [other tags] --iter-gene-coding
Note By default, the setting of --response-gene-feature is 0,1,2,3,4,5,6 (i.e., all non-synonymous variants) and the setting of --explanatory-gene-feature is 7 (i.e., the synonymous variants only).
Note The gene feature code can be found HERE.
This approach is designed for identifying specific cancer driver genes in two scenarios.
1) Evaluation of excess of mutations at non-synonymous variants in which number of synonymous mutations is used as one of explanatory variables in the regression model:
java -jar kggseq.jar --maf-file path/to/file1.maf --out path/to/prefixname --iter-gene-coding --cancer-label XXX
2) Evaluation of excess of mutations at synonymous variants in which no variant is used as an explanatory variable in the regression model: java -jar kggseq.jar --maf-file path/to/file1.maf --out path/to/prefixname --response-gene-feature 7 --explanatory-gene-feature - --iter-gene-coding --cancer-label XXX
The option --cancer-label XXX asks the tool to add cancer-matched predictors into the prediction model. Otherwise, the tool will only use the non-cancer-matched predictors. The values of cancer-matched predictors are integrated in the resource data. The following are the cancer labels. The names of the predictors can be seen below.
| Label | FullName |
| ACC | Adrenocortical carcinoma |
| BLCA | Bladder Urothelial Carcinoma |
| BRCA | Breast invasive carcinoma |
| CESC | Cervical squamous cell carcinoma and endocervical adenocarcinoma |
| CHOL | Cholangiocarcinoma |
| COAD | Colon adenocarcinoma |
| CRL | Cell Line Control |
| DLBC | Lymphoid Neoplasm Diffuse Large B-cell Lymphoma |
| ESCA | Esophageal carcinoma |
| GBM | Glioblastoma multiforme |
| HNSC | Head and Neck squamous cell carcinoma |
| KICH | Kidney Chromophobe |
| KIRC | Kidney renal clear cell carcinoma |
| KIRP | Kidney renal papillary cell carcinoma |
| LAML | Acute Myeloid Leukemia |
| LCML | Chronic Myelogenous Leukemia |
| LGG | Brain Lower Grade Glioma |
| LIHC | Liver hepatocellular carcinoma |
| LUAD | Lung adenocarcinoma |
| LUSC | Lung squamous cell carcinoma |
| MESO | Mesothelioma |
| MISC | Miscellaneous |
| OV | Ovarian serous cystadenocarcinoma |
| PAAD | Pancreatic adenocarcinoma |
| PCPG | Pheochromocytoma and Paraganglioma |
| PRAD | Prostate adenocarcinoma |
| READ | Rectum adenocarcinoma |
| SARC | Sarcoma |
| SKCM | Skin Cutaneous Melanoma |
| STAD | Stomach adenocarcinoma |
| TGCT | Testicular Germ Cell Tumors |
| THCA | Thyroid carcinoma |
| THYM | Thymoma |
| UCEC | Uterine Corpus Endometrial Carcinoma |
| UCS | Uterine Carcinosarcoma |
| UVM | Uveal Melanoma |
Example:
GeneSymbol ResponseVar ResponseVarScore ExplanatoryVar AvgCodingLen expr reptime hic constraint_score Residual P
PIK3CA 340 2167 0 3.307 12.90393121 613 11 5.42012467 54.15940338 0
TP53 341 2770 0 1.448 14.54284996 213 34 1.378924009 81.89842183 0
AKT1 28 178 0 1.554 13.47551291 247 36 4.027570836 19.06261681 2.58E-81
GATA3 106 108 0 1.36 12.11686978 675 -2 2.949085091 13.66765846 7.92E-43
RUNX1 24 92 0 1.639 12.01318547 429 45 2.484099017 12.81066283 7.15E-38
Here are description of the column names.
GeneSymbol: Official gene symbols defined by HGNC.
ResponseVar: The number of mutant alleles as a response variable in the regression.
ResponseVarScore: The number of mutant alleles as a response variable in the regression.
ExplanatoryVar: The number of mutant alleles as an explanatory variable in the regression.
RegionLength: The actual or averaged (of multiple isoforms) length (in kb) of all exons in a gene.
CellLineExpression: Gene expression values were averaged expression across 91 cell lines in the Cancer Cell Line Encylcopedia (CCLE).
ReplicationTiming : DNA replication time of a gene was measured in HeLa cells, ranging from 100 (very early) to 1000 (very late)
Hic: HiC-based chromatin state of a gene was measured from HiC experiments in K562 cells, ranging approximately from -50 (very closed) to +50 (very open)
ConstraintScore: constraint score for de novo mutation potential from
Samocha et al (2014) Nature Genetics.
TissueExpression : Cancer-matched gene expression. Batch effects normalized mRNA data called from RNAseq for each gene. Curated from https://atacseq.xenahubs.net
CNV :Cancer-matched Gene’s copy number variation in cancer tissues, curated from https://atacseq.xenahubs.net
ATACSeq : Cancer-matched Chromatin accessibility by ATAC-Seq data, curated from https://atacseq.xenahubs.net
Methylation : Cancer-matched DNA-methylation level, curated from https://atacseq.xenahubs.net
Residual: Residuals (observed number of mutations - fitted number of mutations) in the regression after correction for the factors above.
P: The probability of be equal or over the StandizedResidue under a standard normal distribution.
AlleleScore: All mutation counts and functions scores used to calculate the mutation burden p-values by ITER or WITER.
BHFDR-q: False Discovery Rate (FDR) q-value for multiple testing by Benjamini-Hochberg procedure.
Cancer-driver gene mutation burden test by weighted iterative zero-truncated negative-binomial regression (WITER) based on somatic mutations
java -jar kggseq.jar --maf-file path/to/file1.maf --out path/to/prefixname [other tags] --witer-gene-coding
Note By default, the setting of --response-gene-feature is 0,1,2,3,4,5,6 (i.e., all non-synonymous variants) and the setting of --explanatory-gene-feature is 7 (i.e., the synonymous variants only).
Note The gene feature code can be found HERE.
This approach is designed for identifying specific cancer driver genes in three scenarios.
1) Evaluation of excess of mutations at non-synonymous variants in which number of synonymous mutations is used as one of explanatory variables in the regression model:
java -jar kggseq.jar --maf-file path/to/file1.maf --out path/to/prefixname --witer-gene-coding --cancer-label XXX
The output of WITER is the same as that of ITER except that the is the weighted somatic mutation counts and is larger than the somatic mutation counts.
Cancer-driver gene mutation burden test by weighted iterative zero-truncated negative-binomial regression with reference sample (WITER-ref) based on somatic mutations
java -jar kggseq.jar --maf-file path/to/file1.maf --out path/to/prefixname [other tags] --witer-gene-coding --ref-mut-file path/to/referenceDataset --cancer-label XXX
Note By default, the setting of --response-gene-feature is 0,1,2,3,4,5,6 (i.e., all non-synonymous variants) and the setting of --explanatory-gene-feature is 7 (i.e., the synonymous variants only).
Note The gene feature code can be found HERE.
This approach is designed for identifying specific cancer driver genes in three scenarios.
1) Evaluation of excess of mutations at non-synonymous variants in which number of synonymous mutations is used as one of explanatory variables in the regression model:
java -jar kggseq.jar --maf-file path/to/file1.maf --out path/to/prefixname --witer-gene-coding --ref-mut-file path/to/referenceDataset --cancer-label XXX
The output of WITER is the same as that of ITER except that the is the weighted somatic mutation counts and is larger than the somatic mutation counts.
...
MergedAlleleNum:The number of weighted mutant alleles from reference samples.
Detect disease susceptibility gene mutation burden test by recursive truncated negative-binomial regression (RUNNER) for complex diseases
![]() Test baseline mutation burden at genes with rare coding variants for complex diseases: --runner-gene-coding
Test baseline mutation burden at genes with rare coding variants for complex diseases: --runner-gene-coding
java -jar kggseq.jar --nt 6 [or more threads] --vcf-file path/to/file1 --ped-file path/to/file2 --out path/to/prefixname [or other tags] --excel --qqplot --db-filter gadexome.[an ancestry tag],gadgenome.[an ancestry tag],1kgeas201305 --rare-allele-freq 0.01 --min-case-control-freq-ratio 3 --filter-case-maf-oe 0.1 --gene-freq-score [an ancestry tag] --runner-gene-coding
NoteThe ancestry tags are defined by Genome Aggregation Database.
| Tag | Ancestry |
| eas | East Asian |
| afr | African/African American |
| sas | South Asian |
| eur | Non-Finnish European |
| fin | Finnish |
| amr | Latino American |
| asj | Ashkenazi Jewish |
| control | For the option --gene-freq-score, the gene frequency score of a local control sample can be used optionally with this tag. However, unless the size of control sample is over 500, the control tag will lead to decreased power according to our experience. |
NoteThe --gene-freq-score should be specified with ancestrally matched population for the analyzed sample.
NoteThe --min-case-control-freq-ratio When there are control samples, this option can be used to filter out variants at which the alternative allele frequency in cases is less than that in controls multiplied by X.
NoteThe --adj-disease --residual-prob X --phe disease1 --cov cov1,cov2,... Adjust the disease statues (--phen) by covariables (--cov) with the logistic regression. Subjects with the absolute value of deviance residual less than the Xth (--residual-prob) quantile of a standard normal distribution will be ignored. The defaud value of X is 0.8. Here are description of the column names in the output file named *.gene.mutationburden.txt.
GeneSymbol: Official gene symbols defined by HGNC.
ResponseVar: The number of mutant alleles.
ResponseVarScore: The number of weighted mutant alleles as a response variable in the regression.
ExplanatoryVar (Optional): The number of mutant alleles as an explanatory variable in the regression.
RegionLength: The length (in kb) of regions where the tested variant type are counted in a gene.
An ancestry tag e.g., EAS : The accumulated allele frequency (named frequency score) in ancestrally matched populations.
RegionLength*tag: The multiplication of RegionLength and ancestry tag used as an interaction term in the regression
Residual:Deviance residual of mutation burden in the regression model.
P: The probability of be equal or over the Standized Residue under a standard normal distribution.
PumMedID(Optional): The queried PubMed ID(s) of papers co-mentioning the gene and phenotypes(or diseases).
BHFDR-q: Q-value calculated by Benjamini Hochberg FDR method for multiple testing.
![]() For advanced users, the following are more options to customize the analysis.
For advanced users, the following are more options to customize the analysis.
1.Perform burden tests without weighting the variants by functional scores --runner1-gene-coding
java -jar kggseq.jar --nt 6 [or more threads] --vcf-file path/to/file1 --ped-file path/to/file2 --out path/to/prefixname [or other tags] --excel --qqplot --db-filter gadexome.[an ancestry tag],gadgenome.[an ancestry tag],1kgeas201305 --rare-allele-freq 0.01 --min-case-control-freq-ratio 3 --filter-case-maf-oe 0.1 --gene-freq-score [an ancestry tag] --runner1-gene-coding
java -jar kggseq.jar --nt 6 [or more threads] --vcf-file path/to/file1 --ped-file path/to/file2 --out path/to/prefixname [or other tags] --excel --qqplot --db-filter gadexome.[an ancestry tag],gadgenome.[an ancestry tag],1kgeas201305 --rare-allele-freq 0.01 --min-case-control-freq-ratio 3 --filter-case-maf-oe 0.1 --gene-freq-score CONTROL --runner-gene-coding
java -jar kggseq.jar --nt 6 [or more threads] --vcf-file path/to/file1 --ped-file path/to/file2 --out path/to/prefixname [or other tags] --excel --qqplot --db-filter gadexome.[an ancestry tag],gadgenome.[an ancestry tag],1kgeas201305 --rare-allele-freq 0.01 --min-case-control-freq-ratio 3 --filter-case-maf-oe 0.1 --gene-freq-score [an ancestry tag] --runner-gene-coding --phenotype-term [disease name] --pubmed-mining-top-gene 10
4.Perform burden tests for other types of coding variants --response-gene-feature 2,3,4,5,6 The 2,3,4,5,6 denotes the codes of gene features.
java -jar kggseq.jar --nt 6 [or more threads] --vcf-file path/to/file1 --ped-file path/to/file2 --out path/to/prefixname [or other tags] --excel --qqplot --db-filter gadexome.[an ancestry tag],gadgenome.[an ancestry tag],1kgeas201305 --rare-allele-freq 0.01 --min-case-control-freq-ratio 3 --filter-case-maf-oe 0.1 --gene-freq-score [an ancestry tag] --runner-gene-coding --response-gene-feature 2,3,4,5,6
java -jar kggseq.jar --nt 6 [or more threads] --vcf-file path/to/file1 --ped-file path/to/file2 --out path/to/prefixname [or other tags] --excel --qqplot --db-filter gadexome.[an ancestry tag],gadgenome.[an ancestry tag],1kgeas201305 --rare-allele-freq 0.01 --min-case-control-freq-ratio 3 --filter-case-maf-oe 0.1 --gene-freq-score [an ancestry tag] --runner-gene-coding --gene-cov-file path/to/file3
Gene score1 score1 ...
SAMD11 2.114 0.076914032 ...
NOC2L 2.345 0.046528595 ...
KLHL17 1.989 0.026329064 ...
PLEKHN1 2.2 0.047853652 ...
... ... ... ...
6.Perform burden tests by customized weights or scores at variants. --var-score-file
java -jar kggseq.jar --nt 6 [or more threads] --vcf-file path/to/file1 --ped-file path/to/file2 --out path/to/prefixname [or other tags] --excel --qqplot --db-filter gadexome.[an ancestry tag],gadgenome.[an ancestry tag],1kgeas201305 --rare-allele-freq 0.01 --min-case-control-freq-ratio 3 --filter-case-maf-oe 0.1 --gene-freq-score [an ancestry tag] --runner-gene-coding --var-score-file path/to/file4.gz
Chromosome POS Reference AlternativeAllele Weights
1 865580 G A 0.000568741
1 865592 A C 0.018698691
1 865544 C +GGCT .
1 865656 G T 0.011239452
1 865701 G A .
... ... ... ... ...
7.Perform burden tests among variants with GC types or not --ignore-ct-var or --only-ct-var java -jar kggseq.jar --nt 6 [or more threads] --vcf-file path/to/file1 --ped-file path/to/file2 --out path/to/prefixname [or other tags] --excel --qqplot --db-filter gadexome.[an ancestry tag],gadgenome.[an ancestry tag],1kgeas201305 --rare-allele-freq 0.01 --min-case-control-freq-ratio 3 --filter-case-maf-oe 0.1 --gene-freq-score [an ancestry tag] --runner-gene-coding --ignore-ct-var
java -jar kggseq.jar --nt 6 [or more threads] --vcf-file path/to/file1 --ped-file path/to/file2 --out path/to/prefixname [or other tags] --excel --qqplot --db-filter gadexome.[an ancestry tag],gadgenome.[an ancestry tag],1kgeas201305 --rare-allele-freq 0.01 --min-case-control-freq-ratio 3 --filter-case-maf-oe 0.1 --gene-freq-score [an ancestry tag] --runner-gene-coding --var-expression-tissues tissue1,tissue2,tissue3 --min-var-expression 0.1
Detect Gene-Gene Interaction by a Recursive trUNcated NEgative-binomial Regression model (GGI-RUNNER) for complex diseases
![]() About GGI-RUNNER
About GGI-RUNNER
GGI-RUNNER is designed specifically for detecting gene-gene interactions involving rare variants in complex diseases. It assesses the enrichment of the rare variant interaction burden among patients compared to the baseline in the general population, rather than focusing on differences in genotype distribution between cases and controls. The baselines are estimated for pairwise genes by a recursive truncated negative-binomial regression model on multiple genomic features available from public data. The unique statistical strategy of GGI-RUNNER makes it particularly well-suited for studies with limited sample sizes.
![]() Gene-gene interaction testing with rare non-synonymous variants for complex diseases: --runner-digene-coding-interact
Gene-gene interaction testing with rare non-synonymous variants for complex diseases: --runner-digene-coding-interact
java -jar kggseq.jar --nt 10 --buildver hg38 --vcf-file path/to/file1 --ped-file path/to/file2 --out path/to/prefixname --db-gene refgene,gencode --gene-feature-in 0,1,2,3,4,5,6 --db-filter gadexome.[an ancestry tag],gadgenome.[an ancestry tag] --rare-allele-freq 0.01 --gene-freq-score [an ancestry tag] --gene-pair-file /path/to/DIEP_SCORES_file --digene-prob 0.9 --runner-digene-coding-interact --qqplot
Note The numerical values following the parameter options can be adjusted flexibly according to needs.
NoteThe --gene-freq-score should be specified with ancestrally matched population for the analyzed sample.
NoteThe --digene-prob should be used in couple with --gene-pair-file, allows for the selection of gene pairs with scores higher than X (e.g. 0.9) for gene-gene interaction analysis. You can download the DIEP_SCORES_file or use other references, but it must adhere to the format of Gene1\tGene2\tScore.
![]() There are more options to customize the analysis
There are more options to customize the analysis
1. Adding quality control filters for individual genotype, genomic variant and sample phenotype (Recommend)
... --hwe-control 1.0E-5 --max-allele 4 --gty-dp 8 --gty-qual 20 --min-obs-rate 0.8 [and other options you need]
2. Specifying variants that are more likely to be enriched in patients (Recommend)
... --min-case-control-freq-ratio 2.0
3. Filtering out variants with a high likelihood of being private in the studied sample (Recommend)
... --filter-sample-maf-oe 0.1
4. Specifying the types of variants to be tested
... --gene-feature-in 0,4,5
Note The 0,4,5 denote the codes of gene feature.
Note The current design of GGI-RUNNER is only applicable to coding variants and does not consider non-coding variants.
5. Ignore variants within some genes
... --genes-out TTN,MUC16,OBSCN
![]() The output
The output
The gene-gene interaction analysis results will summarized in the output file named *.digene.mutationburden.case.txt. The output is in the form
GeneSymbol: Official gene symbols defined by HGNC [Gene1:Gene2].
ResponseVar: The unweighted rare variant interaction burden in patients.
DiGeneScore: The pre-calculate score (e.g. DIEP score) for the gene pair.
ResponseVarScore: The weighted rare variant interaction burden in patients in the regression.
RegionLength: The product of coding region length (in kb) of Gene1 and Gene2.
An ancestry tag e.g., EAS: The product of the accumulated allele frequency (named frequency score) in ancestrally matched populations of Gene1 and Gene2.
RegionLength*tag: The product of RegionLength and ancestry tag used as an interaction term in the regression.
oe_mis: The product of the observed/expected ratios for missense variations (from gnomAD) of Gene1 and Gene2.
oe_lof: The product of the observed/expected ratios for loss-of-function variations (from gnomAD) of Gene1 and Gene2.
ExonGC: The product of the GC content of the exons (from gnomAD) of Gene1 and Gene2.
CtrlVarScore: The weighted (non-integerization) rare variant interaction burden in controls.
Residual: Deviance residual of the rare variant interaction burden in the regression model.
P: The probability of be equal or over the Standized Residue under a standard normal distribution.
BHFDR-q: Q-value calculated by Benjamini Hochberg FDR method for multiple testing.
The QQ plot of P-values will stored in the output file named *.digene.mutationburden.case.qq.png.
Association at variants
See the detailed example options in the short tutorial![]() Conventional statistical association tests at each individual variants: --var-assoc
Conventional statistical association tests at each individual variants: --var-assoc
java -jar ./kggseq.jar --buildver hg19 --var-assoc --p-value-cutoff 0.01 --multiple-testing benfdr --qqplot
Calculate p-values (by chi-squared test) for case-control association and odds ratio. The '--p-value-cutoff' sets p-value cutoffs for filtration; the '--multiple-testing' sets the approaches for multiple testing comparisons; and the '--qqplot' enables Q-Q plot of the association results.
| Multiple testing method | Description |
| no | No multiple testing methods. Set a fixed p value cutoff by --p-value-cutoff. |
| benfdr | Benjamini-Hochberg method, which aims to control the FDR (specified by --p-value-cutoff), or "False Discovery Rate," rather than the FWE or "FamilyWise Error rate". |
| bonhol | Bonferroni-Holm method, which is less conservative and more powerful than the Standard Bonferroni method given a family-wise error rate specified by --p-value-cutoff. |
| bonf | Standard Bonferroni correction given a family-wise error rate specified by --p-value-cutoff. |
PValueAllelic: The p-value calculated by chi-square test for allelic association between case-control status.
OddAllelic: The odds ratio of alleles in cases and controls.
PValueDom: The p-value calculated by chi-square test for genotype association between case-control status under dominant mode.
OddDom: The odds ratio of genotypes in cases and controls under dominant mode.
PValueRec: The p-value calculated by chi-square test for genotype association between case-control status under recessive mode.
OddRec: The odds ratio of genotypes in cases and controls under recessive mode.
PValueGeno: The p-value calculated by chi-square test for genotype association between case-control status.
Note Currently, this function only work for case-control study without confounding factors as covariables.
![]() Variant-based association test by Rvtests: --rvtest-var
Variant-based association test by Rvtests: --rvtest-var
java -jar ./kggseq.jar --rvtest-var score,wald,exact,... --rvtest-vcf --rvtest-remove-set --vcf-file path/to/vcf/file --ped-file path/to/pedigree/file --phe phenotypeName --cov covariateName1,covariateName2,...,covariateNameN --out path/to/prefixname --excel --db-gene refgene
KGGSeq will automatically download the C++ sources codes from Github and un-compress them into a folder named "plugin/rvtests-master" under the KGGSeq working folder. Users are required go into the "rvtests-master" to make an executable file from the C++ source codes. See more in a demonstration video .
| Arguments/values | Annotation |
| --rvtest-var model names | Initiate the calling of RVTest for variants based association analysis. The model names are defined in Rvtests models. Currently, it supports score, wald, exact, dominantExact, famLRT, famScore, famGrammarGamma and firth models. The default models are "score,wald". |
| --rvtest-vcf | Ask KGGSeq to produce a new simplified VCF file, in which only genotypes are included in the FORMAT column, as the input of RVTests. |
| --rvtest-remove-set | Remove the intermediate file defining sets of variants for RVTests group-wise test in your hard disk. |
An extra file with the suffix ".rvtest.variant.xlsx" will be created in the targeted output path.
Association at gene
See the detailed example options in the short tutorial![]() Gene-based association test by SKAT: --skat-gene
Gene-based association test by SKAT: --skat-gene
java -jar ./kggseq.jar --skat-gene --vcf-file path/to/vcf/file --ped-file path/to/pedigree/file --phe phenotypeName --cov covariateName1,covariateName2,...,covariateNameN --out path/to/prefixname --excel --db-gene refgene [--p-value-cutoff 0.01 --multiple-testing benfdr --qqplot]
The gene-based analysis will be carried out by SKAT which was integrated as a plugin in KGGseq.
The '--p-value-cutoff' sets p-value cutoffs for filtration; the '--multiple-testing' sets the approaches for multiple testing comparisons; and the '--qqplot' enables Q-Q plot of the association results.
| Multiple testing method | Description |
| no | No multiple testing methods. Set a fixed p value cutoff by --p-value-cutoff. |
| benfdr | Benjamini-Hochberg method, which aims to control the FDR (specified by --p-value-cutoff), or "False Discovery Rate," rather than the FWE or "FamilyWise Error rate". |
| bonhol | Bonferroni-Holm method, which is less conservative and more powerful than the Standard Bonferroni method given a family-wise error rate specified by --p-value-cutoff. |
| bonf | Standard Bonferroni correction given a family-wise error rate specified by --p-value-cutoff. |
An extra file with the suffix ".skat.gene.xlsx" will be created in the targeted output path. The '--skat-gene' will provide the p values of SKAT,SKATO and Burden test. If the phenotype is binary, the option '--skat-gene binary' can be used, but the speed will decrease.
SKAT:The p-value calculated by SKAT.
SKATO:The p-value calculated by SKAT-O.
Burden:The p-value calculated by Burden test.
Note To use this function, the user should install R language platform first.
Note When total minor allele count (MAC) is very small in a gene, SKATBinary ( '--skat-gene binary' ) has better performance than SKAT( '--skat-gene' ). However, because SKATBinary uses a resampling approach to get a p-value, it is slower (sometimes quite slower) than SKAT function. When MAC is large, the performance of the two tests is similar.
Note The names of phenotype ( '--phe' ) and co-variables ( '--cov' ) are defined in the pedigree file .
Note If the option --skat-cutoff N is added, the genes with variants less than N will not be involved into SKAT. The default value of N is 0.
Note If the option --perm-pheno is added, phenotypes will be permuted prior to association analysis.
![]() Gene-based association test by Rvtests: --rvtest-gene
Gene-based association test by Rvtests: --rvtest-gene
java -jar ./kggseq.jar --rvtest-gene cmc,cmat,price,skat[nPerm=1000:alpha=0.001:beta1=1:beta2=20],... --rvtest-vcf --rvtest-remove-set --vcf-file path/to/vcf/file --ped-file path/to/pedigree/file --phe phenotypeName --cov covariateName1,covariateName2,...,covariateNameN --out path/to/prefixname --excel --db-gene refgene
KGGSeq will automatically download the C++ sources codes from Github and un-compress them into a folder named "plugin/rvtests-master" under the KGGSeq working folder. Users are required go into the "rvtests-master" to make an executable file from the C++ source codes. See more in a demonstration video .
| Arguments/values | Annotation |
| --rvtest-gene model names | Initiate the calling of RVTest for gene based association analysis. The model names are defined in Rvtests models. Currently, it supports cmc, zeggini, mb, fp, exactCMC, cmcWald, rarecover and cmat models.The default models are "cmc,skato[nPerm=1000:alpha=0.001:beta1=1:beta2=20]". |
| --rvtest-vcf | Ask KGGSeq to produce a new VCF file as the input of RVTests. However, this is very time-consuming for large sample. It is advised to use --o-vcf to produce a VCF file with good quality once and to use that cleaned VCF file as the new KGGSeq input. In this scenario, the --rvtest-vcf is not needed, which may substantially reduce the analysis time. |
| --rvtest-remove-set | Remove the intermediate file defining sets of variants for RVTests group-wise test in your hard disk. |
| --rvtest-min-var N | Remove genes with too few variants (< N) for RVTests group-wise test. |
An extra file with the suffix ".rvtest.gene.xlsx" will be created in the targeted output path.
Association at geneset
![]() Geneset-based association test by SKAT: --skat-geneset
Geneset-based association test by SKAT: --skat-geneset
java -jar ./kggseq.jar --skat-geneset --geneset-file path/to/geneset/file --vcf-file path/to/vcf/file --ped-file path/to/pedigree/file --phe phenotypeName --cov covariateName1,covariateName2,...,covariateNameN --out path/to/prefixname --excel --db-gene refgene [--p-value-cutoff 0.01 --multiple-testing benfdr --qqplot]
The gene-based analysis will be carried out by SKAT which was integrated as a plugin in KGGseq.
The '--p-value-cutoff' sets p-value cutoffs for filtration; the '--multiple-testing' sets the approaches for multiple testing comparisons; and the '--qqplot' enables Q-Q plot of the association results.
[Column 1: GeneSet ID]
[Column 2: GeneSet URL]
[Column 3..N: Gene Symbols in the geneset; separated by spaces].
No title row is required!!!
e.g.,
----------------------------------------------
KEGG_GLYCOLYSIS_GLUCONEOGENESIS https://www.gsea-msigdb.org/gsea/msigdb/geneset_page.jsp?geneSetName=KEGG_GLYCOLYSIS_GLUCONEOGENESIS LDHC LDHB LDHA
KEGG_CITRATE_CYCLE_TCA_CYCLE https://www.gsea-msigdb.org/gsea/msigdb/geneset_page.jsp?geneSetName=KEGG_CITRATE_CYCLE_TCA_CYCLE GJB1 OGDHL OGDH PDHB IDH3G LDHB
...
...
An extra file with the suffix ".skat.geneset.xlsx" will be created in the targeted output path. The '--skat-geneset' will provide the p values of SKAT,SKATO and Burden test. If the phenotype is binary, the option '--skat-gene binary' can be used, but the speed will decrease.
SKAT:The p-value calculated by SKAT.
SKATO:The p-value calculated by SKAT-O.
Burden:The p-value calculated by Burden test.
Note To use this function, the user should install R language platform first.
Note When total minor allele count (MAC) is very small in a gene, SKATBinary ( '--skat-gene binary' ) has better performance than SKAT( '--skat-gene' ). However, because SKATBinary uses a resampling approach to get a p-value, it is slower (sometimes quite slower) than SKAT function. When MAC is large, the performance of the two tests is similar.
Note The names of phenotype ( '--phe' ) and co-variables ( '--cov' ) are defined in the pedigree file .
Note If the option --skat-cutoff N is added, the genes with variants less than N will not be involved into SKAT. The default value of N is 0.
Note If the option --perm-pheno is added, phenotypes will be permuted prior to association analysis.
![]() Geneset-based association test by Rvtests: --rvtest-geneset
Geneset-based association test by Rvtests: --rvtest-geneset
java -jar ./kggseq.jar --rvtest-geneset cmc,skato[nPerm=1000:alpha=0.001:beta1=1:beta2=20],... --rvtest-vcf --rvtest-remove-set --geneset-file path/to/geneset/file --vcf-file path/to/vcf/file --ped-file path/to/pedigree/file --phe phenotypeName --cov covariateName1,covariateName2,...,covariateNameN --out path/to/prefixname --excel --db-gene refgene [--p-value-cutoff 0.01 --multiple-testing benfdr --qqplot]
KGGSeq will automatically download the C++ sources codes from Github and un-compress them into a folder named "plugin/rvtests-master" under the KGGSeq working folder. Users are required go into the "rvtests-master" to make an executable file from the C++ source codes. See more in a demonstration video .
| Arguments/values | Annotation |
| --rvtest-geneset model names | Initiate the calling of RVTest for gene based association analysis. The model names are defined in Rvtests models. It supports most of the models, e.g., cmc, zeggini, mb, fp, exactCMC, cmcWald, rarecover,skato and cmat. The default models are "cmc,skato[nPerm=1000:alpha=0.001:beta1=1:beta2=20]". |
| --rvtest-vcf | Ask KGGSeq to produce a new VCF file as the input of RVTests. However, this is very time-consuming for large sample. It is advised to use --o-vcf to produce a VCF file with good quality once and to use that cleaned VCF file as the new KGGSeq input. In this scenario, the --rvtest-vcf is not needed, which may substantially reduce the analysis time. |
| --rvtest-remove-set | Remove the intermediate file defining set of variants for RVTests group-wise test. |
An extra file with the suffix ".rvtest.geneset.xlsx" will be created in the targeted output path. The '--rvtest-geneset' will provide the p values of multiple set-based tests for rare variants.
Plotting
Generate a histogram of minor allele frequency (MAF) according to allele frequencies in reference dataset --mafplot-ref or in sample --mafplot-sample.
java -jar kggseq.jar --vcf-file path/to/file1 --ped-file path/to/file2 --out path/to/prefixname --db-filter 1kg201204,dbsnp141,ESP6500AA,ESP6500EA --allele-freq 0,1 --mafplot-ref
java -jar kggseq.jar --vcf-file path/to/file1 --ped-file path/to/file2 --out path/to/prefixname --mafplot-sample
Note Currently, --mafplot-sample only supports the inputs specified by --vcf-file.
Generate a Quantile-Quantile (Q-Q) plot for association p-values --qqplot
java -jar kggseq.jar --vcf-file path/to/file --out path/to/prefixname --qqplot --skat-gene [or] --var-assoc
Miscellaneous
![]() Calculate pairwise the linkage disequilibrium or genotypic correlation --calc-ld.
Calculate pairwise the linkage disequilibrium or genotypic correlation --calc-ld.
java -Xmx15g -jar kggseq.jar --vcf-file path/to/file --ped-file path/to/file --out path/to/prefixname --calc-ld --db-filter 1kg201204,dbsnp141,ESP6500AA,ESP6500EA --allele-freq 0.05,0.95 --regions-in chr4:21212-233454
If the genotypes are phased, KGGSeq will calculate the linkage disequilibrium coefficient r-square. For uphased genotypes, KGGSeq will calculate the Pearson genotypic correlation of variants, in which the genotypes are encoded by the number of alternative alleles.
Note Currently, --calc-ld only supports variants with two alleles.
Note By default, KGGSeq will only calculate LD between variants within a window of 100,000,000 base-pairs. The window size can be changed by --ld-win X , in which X denotes a distance in base-pair.
Note By default, only the r-square or correlation square >0.01 will be saved in an output file. This can be changed by --ld-out X, in which X denotes r-square or correlation square. .
The results will be outputted in a text file with the suffix ".ld" or ".ld.gz". The following is an exmaple of the output format:
[chromsome] [coordinate of the first variant] [coordinate of the second variant] [r-square OR correlation]
22 16051249 16052962 0.8680002633575351
22 16051249 16053659 0.13732498950210686
22 16051249 16053862 0.984494959737711
![]() Prune variants in high LD (r or genotypic correlation square >= x) --ld-prune X.
Prune variants in high LD (r or genotypic correlation square >= x) --ld-prune X.
java -Xmx15g -jar kggseq.jar --vcf-file path/to/file --ped-file path/to/file --out path/to/prefixname --ld-prune 0.9 --filter-sample-maf-le 0.05 --o-svcf
KGGSeq will calculate the pairwise LD between variants within a window of 100,000,000 base-pairs. If a pair of variants have r-square or correlation square over 0.9, the variation with larger coordinate will be pruned. The variants with minor allele frequency <=5% are excluded (See details on --filter-sample-maf-le). The window size can be changed by --ld-win X, in which X denotes a distance in base-pair.
FAQ?
1) Can a compressed VCF file be processed in parallel?
Yes, it can. However, the files has to be compressed in a blocked GNU Zip format or Burrows–Wheeler format. See more here.
2) Does the KGGSeq binary genotype format support variants of over two alleles and/or phased genotypes?
Yes, it does support variants of over two alleles and/or phased genotypes. See more here.
3) How are the settings '--rare-allele-freq c' and '--allele-freq 0,c' different?
'--rare-allele-freq c' will excluded variants with alternative allele frequency EQUAL to or over c in the reference datasets; and '--allele-freq 0,c' will also excluded variants having no allele frequency in the reference datasets beside the variants excluded by '--rare-allele-freq c'
4) Does KGGSeq provide gene expression information in the output?
A project aiming to harness tissue-specific expression information to prioritize candidate genes is underway.
5) How shall I prepare the candidate gene list for protein-interaction and geneset annotation? What is the gene list for?
The candidate gene list can include any gene interesting to the user. It may be verified causal gene for the disease, or potential causal gene. The gene list is used to fish more hidden interesting genes in order to narrow down the searching region. If no gene list provided, KGGSeq can still perform routine ‘filtration + sharing’ strategy for sequencing data.
6)Suppose I have in-house control genomes in VCF format, how can I transform it into KGGSeq acceptable file?
There are two alternative ways to allow you use the in-house VCF data (containing genotypes of multiple individuals) as filter.
1. Convert the VCF data into a standard KGGSeq local filter format by the command: --make-filter --vcf-file path/to/vcffile --out test.var first. And then set the --local-filter test.hg19.var
2. Directly set --local-filter-vcf path/to/vcffile. However, this way is less efficient than the above way as it will take additional time to parse the VCF data.
7) Is there a practical guidance for MAF selection?
MAF selection is an open question, but generally three suggestions can be adopted: for rare dominant Mendelian disease, MAF cut-off at 0 or 0.005 is reasonable; for rare recessive Mendelian disease, MAF cut-off at 0 or 0.03 is reasonable; for common complex disease of relatively rare alleles with large effect size, MAF cut-off is dependent on disease prevalence, penetrance and genetic model, so a higher cut-off like 0.05 might be more reasonable.
8) Can I use ANNOVAR and KGGSeq together on my dataset?
KGGSeq is quite flexible for interacting with other sequence-oriented analytical programs/software (including SOAPSNP, ANNOVAR, PLINK/seq, VAAST, etc). It can accept various input formats, and output different kinds of sequence data. In case of ANNOVAR, KGGSeq can read ANNOVAR-formatted sequence variants, and write the final remaining variants in ANNOVAR format.
9) Can I run KGGSeq on my Lenovo or Mac laptop? Is it time consuming to run a complete KGGSeq process?
Normally, KGGSeq run well and fast with >=1 GB RAM memory. Hence current laptop are certainty affordable for running KGGSeq. The whole process need only <10 minutes, unless PubMed searching is set in the parameter file. For PubMed searching, it really depends on the speed of the network and also the loading of the NCBI PubMed database.
10) How do I report an error or bugs to KGGSeq?
You are welcomed to join our google group (http://groups.google.com/group/kggseq_user?hl=en). This site is used for communication and discussion of KGGSeq usage and functions. You can also directly write an email to limx54@yahoo.com, or kggseq_user@googlegroups.com.